Download
1 / 2
60 likes | 1.75k Views
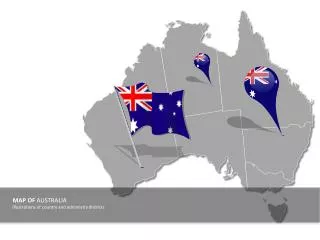
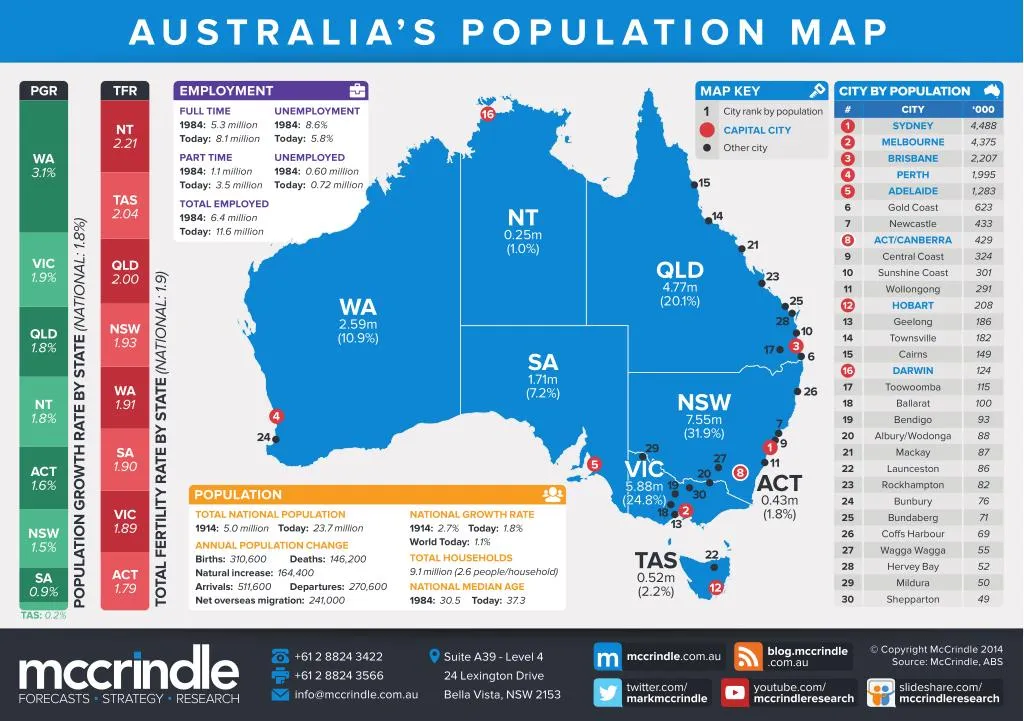
Australia defined demographically and generationally. Here's our latest Population Map. Now in it's 10th edition, more than 100,000 hard copies of this A5 card have been distributed, and many times this in electronic form. We hope it is a useful ready reference for you.

E N D
AU ST R A L I A’ S P O P U L AT I O N M A P ‘000 4,488 4,375 2,207 1,995 1,283 623 433 429 324 301 291 208 186 182 149 124 115 100 93 88 87 86 82 76 71 69 55 52 50 49 # 1 2 3 4 5 6 7 8 9 10 11 12 13 14 15 16 17 18 19 20 21 22 23 24 25 26 27 28 29 30 CITY SYDNEY MELBOURNE BRISBANE PERTH ADELAIDE Gold Coast Newcastle ACT/CANBERRA Central Coast Sunshine Coast Wollongong HOBART Geelong Townsville Cairns DARWIN Toowoomba Ballarat Bendigo Albury/Wodonga Mackay Launceston Rockhampton Bunbury Bundaberg Coffs Harbour Wagga Wagga Hervey Bay Mildura Shepparton 16 Today: 5.8% WA 3.1% 15 Today: 0.72 million NT 0.25m (1.0%) VIC 1.9% QLD 4.77m (20.1%) WA 2.59m (10.9%) QLD 1.8% SA 1.71m (7.2%) NSW 7.55m (31.9%) NT 1.8% 11 ACT 1.6% ACT 0.43m (1.8%) Today: 23.7 million NSW 1.5% World Today: 1.1% TAS 0.52m (2.2%) Births: 310,600 Natural increase: 164,400 Deaths: 146,200 9.1 million (2.6 people/household) SA 0.9% Arrivals: 511,600 Net overseas migration: 241,000 Departures: 270,600 12 TAS: 0.2%
AU ST R A L I A’ S G E N E R AT I O N A L P R O F I L E <5 69+ 50-68 35-49 20-34 5-19 POPULATION 2.51 million - 11% % OF WORKFORCE POPULATION 5.20 million - 22% % OF WORKFORCE Today: 27% | 2025: 13% UNI DEGREE: 1 in 5 POPULATION 4.86 million - 21% % OF WORKFORCE Today: 35% | 2025: 29% UNI DEGREE: 1 in 4 POPULATION 5.15 million - 22% % OF WORKFORCE Today: 31% | 2025: 31% UNI DEGREE: 1 in 3 POPULATION 4.43 million - 19% % OF WORKFORCE Today: 6% | 2025: 27% UNI DEGREE: 1 in 2 POP. 1.6 m 7% 0 Today: 1% | 2025: 0% UNI DEGREE: 1 in 10 ‘40 ‘50 ‘60 ‘70 ‘80 ‘90 ‘00 ‘10 1935 1945 1955 1965 1975 1985 1995 2005 2015 6 million POWERED BY SOCIAL RESEARCH SOCIAL COMMENTARY STRATEGIC PLANNING CORPORATE ADVISORY RESEARCH COMMUNICATIONS researchvisualisation.com mccrindle.com.au TM