Download
1 / 1
20 likes | 556 Views
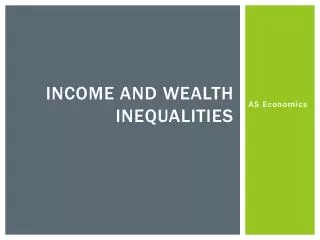
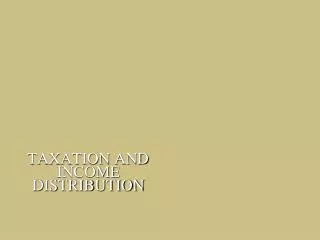
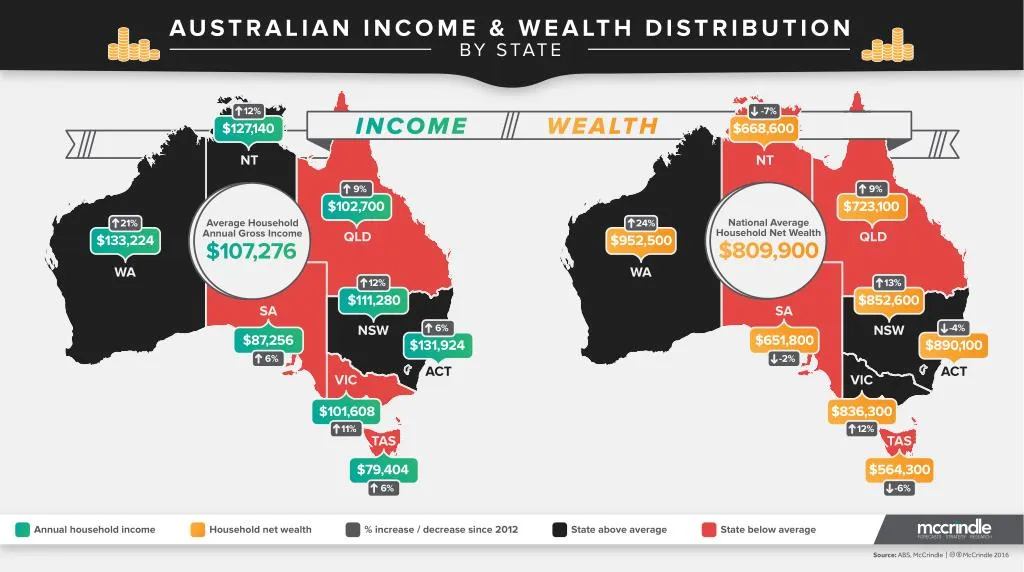
Australia has long been considered the land of the middle class, but in recent years the gap has been widening between the rich and the poor. When it comes to the battle of the states, which corner of Australia scores the highest and the lowest on the income and wealth report? Will the Baby Boomer generation continue their stronghold on our national wealth?<br><br>IS AUSTRALIA STILL THE LAND OF THE MIDDLE CLASS?<br>It is hanging in there, but it’s under pressure. We have seen some hollowing out in the middle of the earnings and a bit of spread to either end. The average annual household earnings are around $107,000 however the lowest fifth of households earn 20% of this while the top fifth average almost three times this. That means that the top fifth of households are taking home about 12 times what the bottom fifth of households are earning.<br><br>MOST AUSSIES HAVE THEIR WEALTH TIED UP IN THEIR HOMES, HOW DOES OWNERSHIP COMPARE WITH THE TOP, MIDDLE AND LOWER CLASSES?<br>The average wealth (if you liquidate everything and pay off all your debts, what are you left with) is about $800,000. The bottom 1 in 5 have a net worth of just $35,000, the top 20% of all household have a net worth of about $2,500,000. That means that the top fifth of households have about 62% of Australia’s wealth, and the bottom fifth take less than 1% of Australia’s national private wealth. So that's a big difference in wealth across these households.<br><br>WHICH STATES ARE BEST AND WORST PERFORMERS WHEN WE ARE LOOKING JUST AT INCOME?<br>The mining boom in WA has really done a great thing over there and so they are leading the earnings chart, with the ACT not too far behind with public servant wages doing pretty well. At the bottom of the tree you have Tasmania, earning about $50,000 less per annum, per household, than what we have in the west.

E N D
AUSTRALIAN INCOME & WEALTH DISTRIBUTION BY STATE 12% -7% $127,140 $668,600 NT NT 9% 9% $102,700 $723,100 National Average Household Net Wealth Average Household Annual Gross Income 21% 24% QLD QLD $133,224 $952,500 WA WA 12% 13% $111,280 $852,600 SA SA 6% -4% NSW NSW $87,256 6% $651,800 -2% $131,924 $890,100 ACT ACT VIC VIC $101,608 11% $836,300 12% TAS TAS $79,404 6% $564,300 -6% Annual household income Household net wealth % increase / decrease since 2012 State above average State below average Source: ABS, McCrindle | cbMcCrindle 2016