Download
1 / 1
30 likes | 1.15k Views
AUSTRALIA’S POPULATION INCREASE (LAST 12 MONTHS): <br>Australia’s annual growth rate is 1.8% which equates to 405,400 people over the last year. In 2008 net overseas migration was 459,904 (therefore population growth numbers in the last year were 54,504 less than they were 5 years ago). <br>Annual growth is comprised of two factors: natural increase (births minus deaths) and net overseas migration (permanent arrivals minus permanent departures). A permanent arrival is defined by someone living in Australia for 12 months or more (or 12 months over a 16 month period). The same time frames apply to permanent departures. <br>59% of Australia’s population increase is through migration which was 241,000 people last year. In 2008 net overseas migration was 315,700 which equates to 74,700 fewer last year than 5 years ago. 41% of Australia’s population growth was through natural increase which was 164,400 people. <br>Natural increase: 164,400 (41% of population growth) <br>Births: 310,600 <br>Deaths: 146,200 <br>Net overseas migration: 241,000 (59% of population growth) <br>Arrivals: 511,600 <br>Departures: 270,600 <br>The net overseas migration rate for the last decade has been hovering around 1% per annum (that is, it is the equivalent of about 1% of our population while the natural increase is equivalent to about 0.8% to our population). <br>42% of those migrating are given permanent visas which was 101,230 in the last year. Therefore those given permanent visas account for 25% of Australia’s population growth. <br>Of the net overseas migration, 58% are granted temporary visas (students, working holiday makers, visitors staying 12 months or more, 457 work visas), and 42% are granted permanent visas (skilled, family and humanitarian). <br>20% of these are part of Australia’s humanitarian program- a total of 19,930 (with the remainder being skilled visas, 43%, and family visas, 37%), and so Australia’s humanitarian program accounts for 5% of Australia’s growth. <br>Of the humanitarian visas, 63% are granted offshore (as part of the UNHCR program in operation, particularly in the Middle East, Africa and Asia), 12% are granted to existing visa holders who are already in Australia, and 25% are granted to people who have arrived into Australian territorial waters by boat and are processed in detention centres (a total of 4,949 in the last year). <br>Therefore asylum seekers account for 1.2% of Australia’s population growth. <br>Immigration Detention and Community Statistics Summary <br><br>As at 31 May 2014, there were 4016 people in immigration detention facilities, including 2779 in immigration detention on the mainland and 1237 in immigration detention on Christmas Island. <br><br>Of these people in detention, 89% had arrived by boat (3566 people). The number in detention facilities currently is less than half the number that were in detention facilities a year ago (In May 2013 there were 8521).

E N D
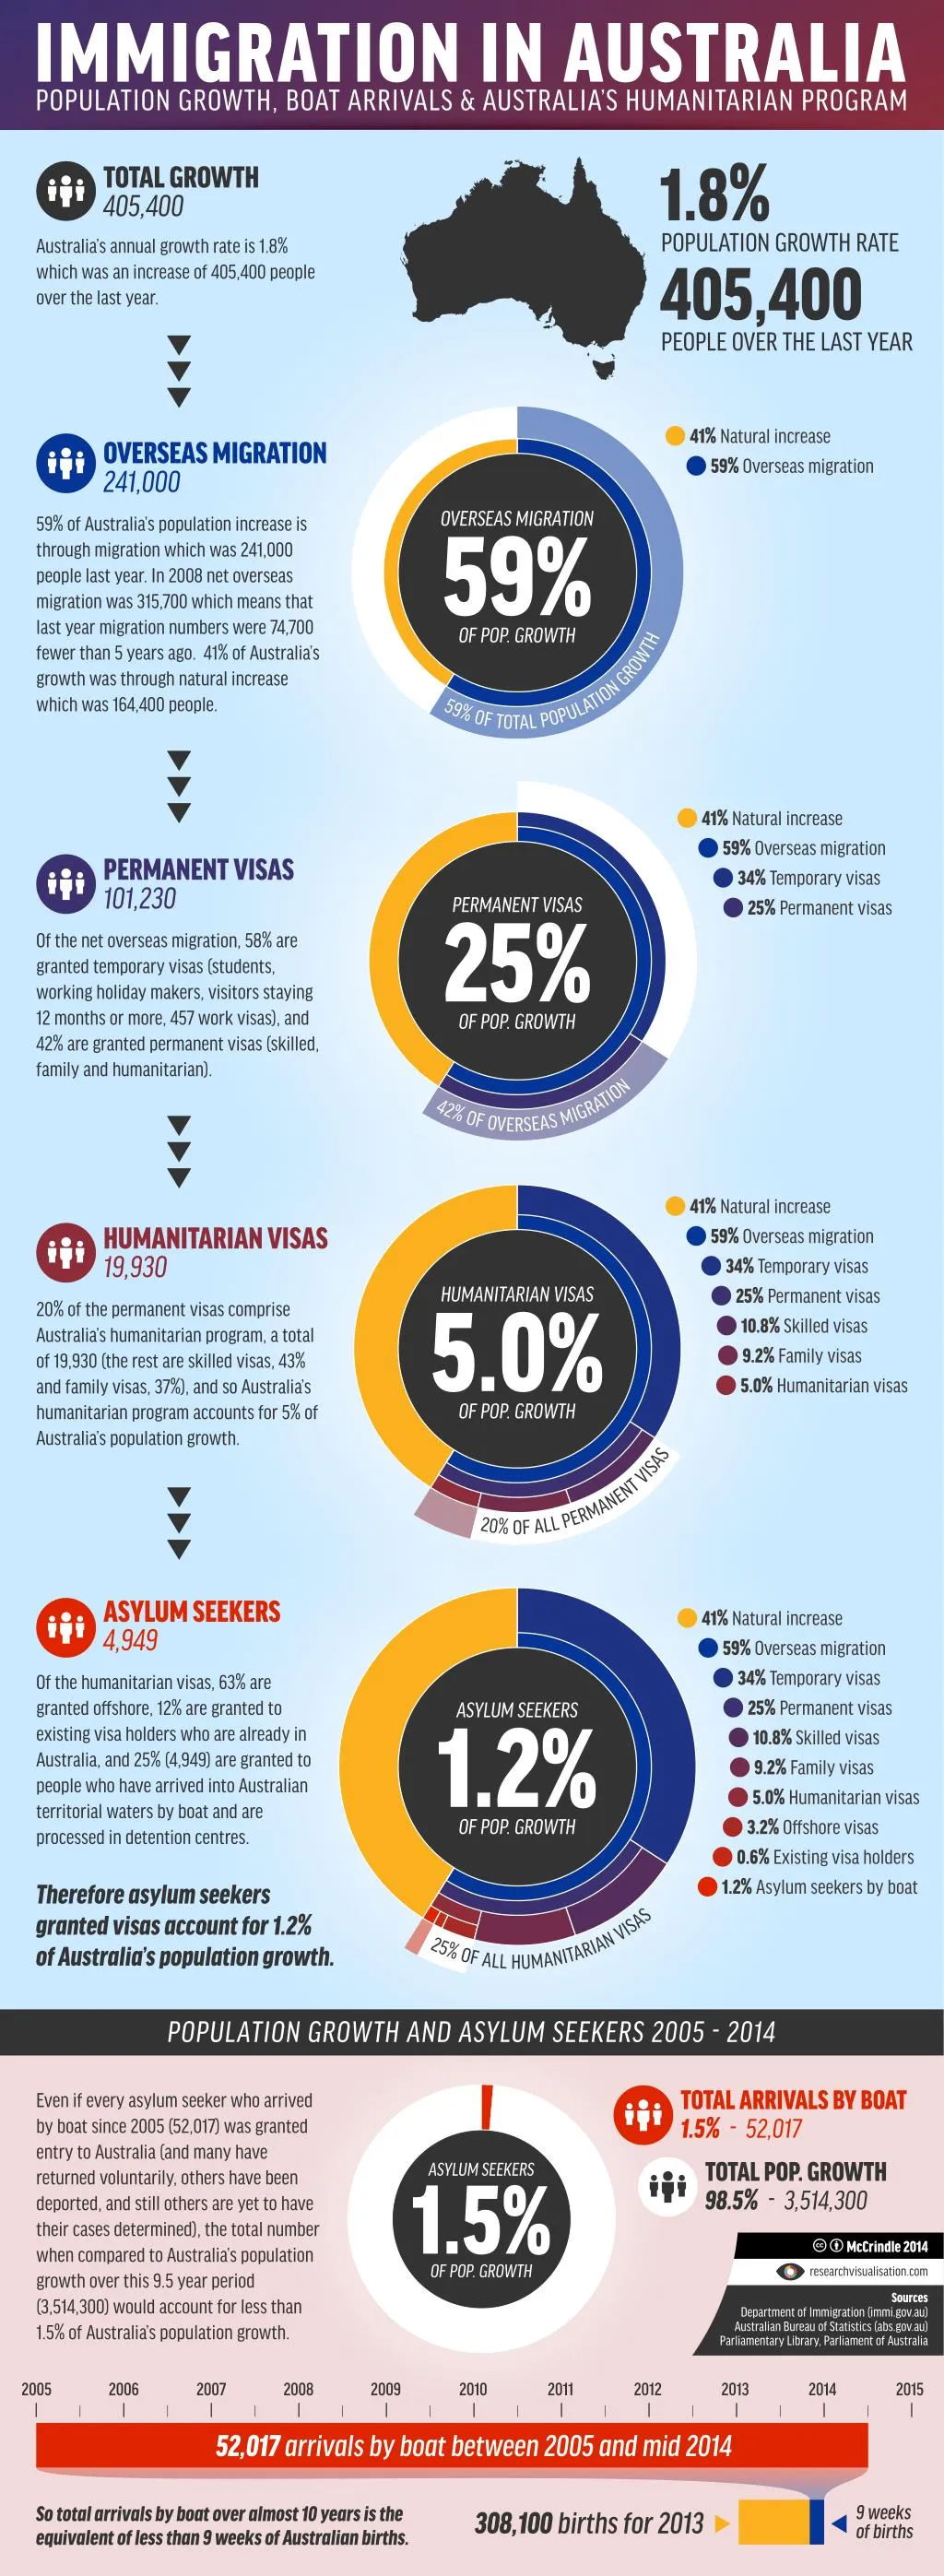
IMMIGRATION IN AUSTRALIA POPULATION GROWTH, BOAT ARRIVALS & AUSTRALIA’S HUMANITARIAN PROGRAM 1.8% POPULATION GROWTH RATE 405,400 PEOPLE OVER THE LAST YEAR TOTAL GROWTH 405,400 Australia’s annual growth rate is 1.8% which was an increase of 405,400 people over the last year. 41% Natural increase 59% Overseas migration OVERSEAS MIGRATION 241,000 OVERSEAS MIGRATION 59% OF POP. GROWTH 59% of Australia’s population increase is through migration which was 241,000 people last year. In 2008 net overseas migration was 315,700 which means that last year migration numbers were 74,700 fewer than 5 years ago. 41% of Australia’s growth was through natural increase which was 164,400 people. 59%OFTOTAL POPULATIONGROWTH 41% Natural increase 59% Overseas migration 34% Temporary visas 25% Permanent visas PERMANENT VISAS 101,230 PERMANENT VISAS 25% OF POP. GROWTH Of the net overseas migration, 58% are granted temporary visas (students, working holiday makers, visitors staying 12 months or more, 457 work visas), and 42% are granted permanent visas (skilled, family and humanitarian). 42%OFOVERSEASMIGRATION 41% Natural increase 59% Overseas migration 34% Temporary visas 25% Permanent visas 10.8% Skilled visas 9.2% Family visas 5.0% Humanitarian visas HUMANITARIAN VISAS 19,930 HUMANITARIAN VISAS 5.0% OF POP. GROWTH 20% of the permanent visas comprise Australia’s humanitarian program, a total of 19,930 (the rest are skilled visas, 43% and family visas, 37%), and so Australia’s humanitarian program accounts for 5% of Australia’s population growth. 20% OFALLPERMANENTVISAS ASYLUM SEEKERS 4,949 41% Natural increase 59% Overseas migration 34% Temporary visas 25% Permanent visas 10.8% Skilled visas 9.2% Family visas 5.0% Humanitarian visas 3.2% Ofshore visas 0.6% Existing visa holders 1.2% Asylum seekers by boat Of the humanitarian visas, 63% are granted ofshore, 12% are granted to existing visa holders who are already in Australia, and 25% (4,949) are granted to people who have arrived into Australian territorial waters by boat and are processed in detention centres. ASYLUM SEEKERS 1.2% OF POP. GROWTH Therefore asylum seekers granted visas account for 1.2% of Australia’s population growth. 25%OFALLHUMANITARIANVISAS POPULATION GROWTH AND ASYLUM SEEKERS 2005 - 2014 TOTAL ARRIVALS BY BOAT 1.5% - 52,017 TOTAL POP. GROWTH 98.5% - 3,514,300 Even if every asylum seeker who arrived by boat since 2005 (52,017) was granted entry to Australia (and many have returned voluntarily, others have been deported, and still others are yet to have their cases determined), the total number when compared to Australia’s population growth over this 9.5 year period (3,514,300) would account for less than 1.5% of Australia’s population growth. ASYLUM SEEKERS 1.5% OF POP. GROWTH c bMcCrindle 2014 researchvisualisation.com Sources Department of Immigration (immi.gov.au) Australian Bureau of Statistics (abs.gov.au) Parliamentary Library, Parliament of Australia 2005 2006 2007 2008 2009 2010 2011 2012 2013 2014 2015 52,017 arrivals by boat between 2005 and mid 2014 9 weeks of births So total arrivals by boat over almost 10 years is the equivalent of less than 9 weeks of Australian births. 308,100 births for 2013