Download
1 / 45
450 likes | 2.33k Views
Australia is growing as is the population of the Northern Territory, but the growth in the Northern Territory is cyclical, with patterns associated with employment, the economic cycle, and strongly linked to variable interstate population increases and decreases. Annual population growth rates in the Northern Territory are highly volatile, and since 1990 have ranged from population contraction to a growth rate three times the national growth rate. These volatile population growth patterns are influenced by the NT’s small population base and the cyclical nature of mining, construction and infrastructure development.

E N D
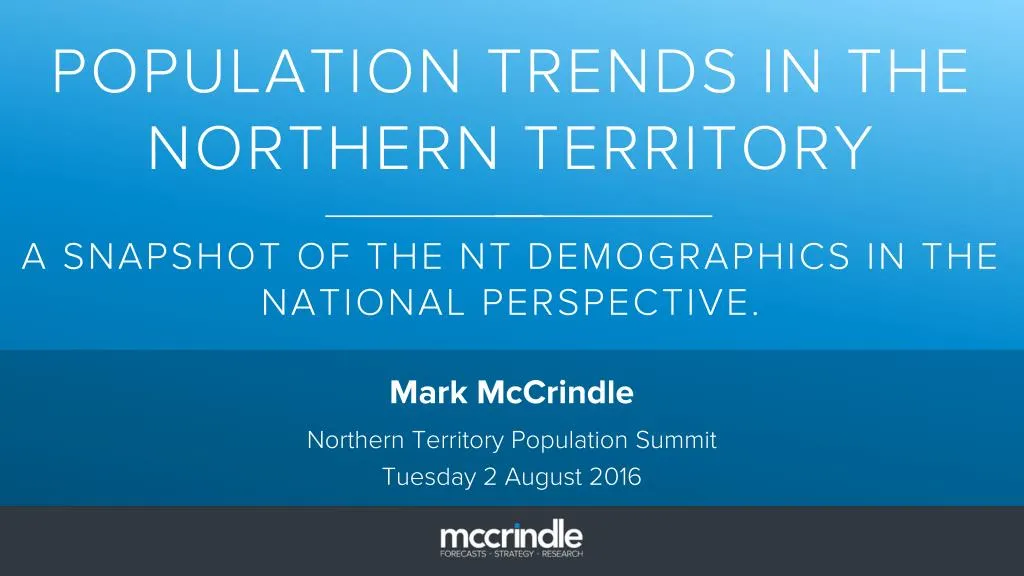
POPULATION TRENDS IN THE NORTHERN TERRITORY • A SNAPSHOT OF THE NT DEMOGRAPHICS IN THE NATIONAL PERSPECTIVE. Mark McCrindle Northern Territory Population Summit Tuesday 2 August 2016
AUSTRALIA IN 2011 21.5m
AUSTRALIA TODAY 24.1m
AUSTRALIA TODAY 24.1m 12%
NORTHERN TERRITORY IN 2011 211,945 Population 2011
NORTHERN TERRITORY TODAY 245,217 Population 2016
NORTHERN TERRITORY TODAY 245,217 Population 2016 16%
NT POPULATION INCREASE FROM 2006 TO 2011 192,898 Population 2006
NT POPULATION INCREASE FROM 2006 TO 2011 211,945 192,898 Population 2011 Population 2006
NT POPULATION INCREASE FROM 2006 TO 2011 211,945 192,898 10% Population 2011 Population 2006
AUSTRALIA IN 2025 287,923 27m NT Population 2025
AUSTRALIA IN 2025 287,923 27m NT Population 2025 42,703
MIGRATION 739 2732 2833 Net Overseas Migration Natural Increase Interstate Migration
% OF STATE POPULATION LIVING IN CAPITAL Perth 77%
% OF STATE POPULATION LIVING IN CAPITAL Perth Melbourne 76% 77%
% OF STATE POPULATION LIVING IN CAPITAL Perth Sydney Melbourne 76% 77% 65%
% OF STATE POPULATION LIVING IN CAPITAL Perth Darwin Sydney Melbourne 76% 77% 65% 57%
% OF STATE POPULATION LIVING IN CAPITAL Brisbane Perth Darwin Sydney Melbourne 76% 77% 65% 57% 48%
AUSTRALIA 3/4 1/4
NORTHERN TERRITORY 2/3 1/3
5 Years • average tenure
5 Years • average tenure 2 in 3 unlikely to move back
MEDIAN AGE Australia 37
MEDIAN AGE Australia Darwin 37 33
MEDIAN AGE Australia Darwin NT 37 33 31
FULL TIME EMPLOYMENT Australia 59.7%
FULL TIME EMPLOYMENT NT Australia 66.9% 59.7%
FULL TIME EMPLOYMENT NT Darwin Australia 69.4% 66.9% 59.7%
WHERE ARE THE JOBS? UNEMPLOYMENT RATE Unemployment rate by state
COST OF LIVING AFTER HOUSING Average income after housing costs
Mark McCrindle 02 8824 3422 www.mccrindle.com.au mark@mccrindle.com.au