Download
1 / 24
240 likes | 252 Views
Mercury and CO 2 Emissions from the Power Generation Sector. By C.V. Mathai, Ph. D. Manager for Environmental Policy Arizona Public Service Company Phoenix, Arizona A Presentation at the DENR/DAQ Mercury/CO 2 Workshop Raleigh, North Carolina April 20, 2004. Overview. Introduction

E N D
Mercury and CO2 Emissionsfrom the Power Generation Sector By C.V. Mathai, Ph. D. Manager for Environmental Policy Arizona Public Service Company Phoenix, Arizona A Presentation at the DENR/DAQ Mercury/CO2 Workshop Raleigh, North Carolina April 20, 2004
Overview • Introduction • Mercury Emissions and Proposed Regulation • Global Climate Change • United Nations Framework Convention on Climate Change (UNFCCC) • Kyoto Protocol • Multi-Pollutant Legislation • Summary and Conclusions
Electricity and Fuel Diversity • Power generation is a major contributor to national air pollutant emissions • SO2: 63% • NOx: 22% • Hg: 37% • CO2: ~40% • A diverse fuel mix is critical to ensure electrical reliability, minimize price volatility, and strengthen national security Hydro/ Fuel Oil Other 3 % Renewables 11 % Gas 16 % Coal 51 % Nuclear 20% Current Generation Mix (Numbers exceed 100% due to rounding.) Source: Form EIA-759 and Form EIA-860B
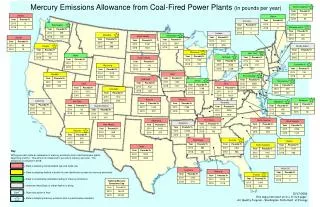
Contributions to Global Anthropogenic Emissions of Mercury (t/yr) Oceania 53 Rest of North America 71 United States 155 (utilities: 48) Africa 271 South & Central America 194 Europe 560 Asia 1232 Global total: 2536 T/y Source: EPRI
0 to 20% 20 to 40% 40 to 60% 60 to 80% 80 to 100% Is there a mercury management “floor”? Mercury entering the U.S. from other countries Percent of mercury deposition that originates outside of the U.S. PORTION OF THE U.S. WHERE LESS THAN 20% OF THE MERCURY ORIGINATES IN OTHER COUNTRIES PORTIONS OF THE U.S. WHERE MORE THAN 60% OF THE MERCURY ORIGINATES IN OTHER COUNTRIES EPRI TEAM regional model, global chemical model
Chlorine and Mercury Emissions • Mercury emissions from power plants occur in three forms: Elemental, Oxidized, and Particle-bound • Chlorine concentration in coal has a significant impact on the type of Hg emissions: • Lower the Cl level, higher the elemental Hg fraction • higher the Cl level, higher the oxidized and particulate Hg fractions • Oxidized and particulate Hg fractions are easily controllable in conventional pollution control devices, but not elemental Hg • PM and SO2 controls are not efficient to remove elemental Hg, i.e., little “Co-benefits”
Mercury Removal with PAC Upstream of Fabric Filters and ESPs
Mercury MACT • 1990 CAA required EPA to Report to Congress on the need to regulate Hg emissions from power generation sources (Report submitted in 1998) • In 1999, EPA assembled the “ICR” database • In Dec 2000, EPA made a regulatory finding that controlling utility Hg emissions was “necessary and appropriate” triggering the CAA Maximum Achievable Control Technology (MACT) provision • For existing sources, MACT is defined as the average emission limitation achieved by the best performing 12% • For new sources, MACT is the “best of the best” • EPA proposed three options to regulate Hg emissions from coal-fired power plants; Rule to become final by Dec 2004
EPA’s Proposed Mercury Rule • EPA proposed three approaches to control mercury from coal-fired power plants: • Traditional, plant-by-plant MACT controls, achieving 29% reduction by Dec. 2007 (via CAA Section 112 MACT) • A two-phased cap-and-trade program, reducing Hg emissions by 69% by 2018, administered by the EPA (via CAA Section 112(n)(1)(A)) • A similar cap-and trade program, but administered by the States and SIPs (via CAA Section 111) • Public comments are due by April 30, and EPA to finalize the Rule by Dec. 15, 2004
Global Climate Change • In 1988, the United Nations Environmental Program and the World Meteorological Organization established the Intergovernmental Panel on Climate Change (IPCC) • Based on the IPCC’s 1990 First Assessment Report, world leaders adopted the United Nations Framework Convention on Climate Change (UNFCCC) at the Earth Summit in Rio de Janeiro, Brazil in 1992 • UNFCCC’s Objective is “.... stabilization of greenhouse gas concentrations in the atmosphere at a level that would prevent dangerous anthropogenic interference with the Climate system” • The UNFCCC has been ratified by a large number of countries, including the U.S., and is in effect as of 1994 • Conferences of Parties (COPs) to the UNFCCC has been held annually since 1995
UNFCCC Commitments Annex I Parties commit themselves ... • “The policies and measures will aim to return emissions of CO2 and other greenhouse gases, individually or jointly, to their 1990 levels” • “... adopt national policies and take measures on the mitigation of climate change by limiting its anthropogenic emissions of greenhouse gases...” • “These Parties may implement such policies and measures jointly with other Parties and may assist other Parties in contributing to the achievement of the objective of the convention”
THE KYOTO PROTOCOL • In 1997 COP-3 agreed on a “protocol” establishing legally-binding “differentiated” emission limits for 38 industrialized countries reducing their annual average GHG emissions by about 5.2% below its 1990 level, during 2008-2012; United States’ share is 7% below 1990 emissions • The Protocol incorporates several “compliance flexibility” measures -- five-year emission budgets, banking, inclusion of sinks, six greenhouse gases, international emission trading, joint implementation, and a “Clean Development Mechanism” • It marks a major first step towards the objective of the UNFCCC, i.e., to stabilize atmospheric concentrations of greenhouse gases at a “safe” level • The Protocol does not call for any emission limits for developing countries
U.S. Actions on Climate Change • In 2001 U.S. withdrew from the Kyoto Protocol; Bush Administration is embarking on a voluntary program to cut carbon intensity (GHG emissions/GDP) • There is momentum building to initiate some form of domestic action on carbon, independent of the Kyoto Protocol process • A number of States have initiated programs to reduce GHG emissions • Proposals to reduce CO2 emissions from power generation sources are pending before the Congress • McCain/Lieberman Bill failed in the Senate by 43 to 55
Multi-Pollutant Legislation • Several proposals are pending before Congress calling for a coordinated, market-based approach to reduce multiple pollutant emissions from the power generation sector: • Clear Skies Act (Bush Bill) • Clean Air Planning Act (Carper Bill) • Clean Power Act (Jeffords Bill)
The Alternative under the Clean Air Act is a Complex Set of Requirements Covering the Power Sector NSR Permits for new sources & modifications that increase emissions Note: Dotted lines indicate a range of possible dates. 1 The D.C. Circuit Court has delayed the May 1, 2003 EGU compliance date for the section 126 final rule 2 Further action on ozone would be considered based on the 2007 assessment. 3 The SIP-submittal and attainment dates are keyed off the date of designation; for example, if PM or ozone are designated in 2004, the first attainment date is 2009 EPA is required to update the new source performance standards (NSPS) for boilers and turbines every 8 years 8-hr Ozone Attain- ment Demon- stration SIPs due Designate areas for 8-hr Ozone NAAQS 1-hr Severe Area Attainment Date Marg-inal 8-hr Ozone NAAQS Attain-ment Date Assess Effectiveness of Regional Ozone Strategies Moderate 8-hr Ozone NAAQS Attainment Date Ozone 1-hr Serious Area Attainment Date NOx SIP Call Red-uc-tions Possible Regional NOx Reductions ? (SIP call II) 2 NOx SIPs Due Section 126 NOx Controls 1 OTC NOx Trading Serious 8-hr Ozone NAAQS attainment Date 04 06 07 08 09 10 12 13 15 16 17 18 05 99 00 01 02 03 11 14 Compliance for BART Sources Compliance for BART sources under the Trading Program Mercury Determination Proposed Utility MACT Final Utility MACT Compliance with Utility MACT Second Regional Haze SIPs due New Fine PM NAAQS Implementation Plans Designate Areas for Fine PM NAAQS Latest attainment date for Fine PM NAAQS 3 Phase II Acid Rain Compliance Interstate Transport Rule to Address SO2/ NOx Emissions for Fine PM NAAQS and Regional Haze Regional Haze SIPs due In developing the timeline of current CAA requirements, it was necessary for EPA to make assumptions about rulemakings that have not been completed or, in some case, not even started. EPA’s rulemakings will be conducted through the usual notice-and-comment process, and the conclusions may vary from these assumptions. Acid Rain, PM2.5, Haze, Toxics
Multi-Pollutant Control Legislative ProposalsProposed Emissions Caps (Tons / Year) Source: EIA AEO 2003 Reference Case Forecast, S.485, S.366, S.843
Summary and Conclusions • Mercury is a global air pollutant and U.S. Power Plants’ emissions contribute only about 2% of the total man-made Hg emissions • Recent studies show that 60% or more of the Hg deposition in the U.S., except for some areas in the East, originate outside the U.S. • Activated Carbon Injection can effectively control mercury at coal-fired power plants • EPA has proposed three approaches to control Hg emissions from coal-fired power plants -- A MACT program and two cap-and-trade programs; a final Rule is expected by Dec 2004
Summary and Conclusions (Contd.) • Global CO2 emissions and atmospheric CO2 concentrations are steadily increasing and there is increasing public support for climate-related action • The Kyoto Protocol appears to be “dead;” global agreement for action on climate is likely only if the U.S. provides leadership • Current pollutant-by-pollutant, source-by-source Clean Air Act regulatory program is complex, costly, and inefficient • An integrated emission reduction strategy, like the proposed Clear Skies Act, is necessary to make cost-effective and timely emission reductions to achieve improved air quality and to ensure affordable and reliable electric power supply