Download

1 / 33
340 likes | 463 Views
Island Biogeograhy and Community Diversity. Islands differ in species number. Hawaii. A somewhat smaller island. Much of this variation is explained solely by the size of the island…. In general, larger islands have more species. 17 species. 28 species. 8 species.

E N D
Islands differ in species number Hawaii A somewhat smaller island Much of this variation is explained solely by the size of the island…
In general, larger islands have more species 17 species 28 species 8 species
Also applies to habitat islands In all cases, the link between area and species number is remarkably constant
The species area relationship c = 5; z =.2 Species Number (S) c = 5; z =.1 Island Area (A)
Re-writing the species area relationship • In this form, it is easy to see that c represents the intercept and z the slope of the species area relationship c = 5; z =.2 Log[Species Number (S)] c = 5; z =.1 Log[Island Area (A)]
Using the species area relationship • The number of fish species in a series of mountain lakes has been estimated • The area of each lake has been estimated S = 22 A = 100km2 S = 32 A = 140km2 S = 45 A = 200km2 S = 16 A = 90km2 S = 52 A = 300km2 S = 38 A = 180km2
Using the species area relationship • As a result of irrigation, one of these lakes has had its water level reduced • The new area of this lake has been estimated • How many fish species do you predict will survive in this lake? S = ? A = 180km2 S = 52 A = 300km2
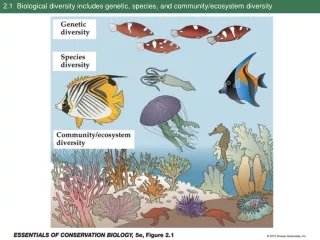
Why does the species area relationship exist? • Habitat diversity • – Explains the S.A. relationship as a function of availability of ecological niches • The equilibrium model of island biogeography • – Explains the S.A. relationship as a balance between immigration and extinction
Habitat diversity • Perhaps larger island simply have more niches This small island has only two niches and thus only two species This large island has four niches and thus four species
An example from Australian Gobies (Kodric-Brown and Brown, 1993) • Spring pool size explains the # of species • Spring size ALSO explains the identity of the species • This is because larger springs have all the habitats of smaller springs plus more
A counter example from red mangrove islands (Simberloff, 1976) • Experimentally reduced island size (using brute force) • Because the islands consisted of only a single host/habitat species (Rhizophera mangle) this manipulation changed only island size • The number of arthropod species declined after island area was reduced even though the number of habitat types remained constant • Not consistent with diversity of habitats as explanation Studied arthropod diversity on monospecific mangrove islands Rhizophera mangle
The equilibrium model of island biogeography (MacArthur and Wilson, 1967) • Hypothesized that the change in species number on an island represents the • difference between rates of immigration and extinction • The equilibrium # of species on an island should occur whenever: But what are the rates of immigration and extinction?
The equilibrium model of island biogeography • Assume that the rate of extinction ( S ) depends upon S S = 22 species More species go extinct per unit time on this island E Extinction rate (S) P = 30 0 0 P S = 12 species # of species on island (S) • The number of species going extinct per unit time increases with S, simply because there are more species to possibly go extinct. When S = P, S = E
The equilibrium model of island biogeography • Assume that the rate of immigration ( S ) depends upon S S = 22 species I Immigration rate (S) P = 30 0 0 P S = 12 species # of species on island (S) More species immigrate to this islandper unit time • The number of species immigrating per unit time decreases with S, simply because there are fewer species to immigrate. When S = P, S = 0.
The equilibrium model of island biogeography • Substituting terms for immigration and extinction shows that: • As a result, the equilibrium species number on the island is: This is a dynamic equilibrium which occurs because extinctions precisely balance immigrations! Thus the MacArthur—Wilson model is characterized by species turnover
The equilibrium model of island biogeography • The equilibrium # of species on the island can also be found graphically • So too, can the rate of species turnover, I E Extinction rate (S) Immigration rate (S) 0 0 0 P 0 P # of species on island (S) # of species on island (S) I E 0 0 P # of species on island (S)
How would you calculate the equilibrium rate of species turnover?
The equilibrium model of island biogeography So far we have seen that: • The number of species on an island represents an equilibrium between extinction • and recolonization • This equilibrium is dynamic, and characterized by continual species turnover • Time 1: {S1,S3,S5,S6} Time 2: {S1,S3,S5,S7} Time 3: {S2,S3,S5,S7} But how does any of this explain the species area effect?
The equilibrium model of island biogeography We must make two additional assumptions: 1. The total population size of a species is proportional to island area - Makes sense if resources are limiting 2. Extinction risk is less for large islands with large populations sizes - Unavoidable because of demographic stochasticity
The equilibrium model of island biogeography 1 I E1 Immigration rate (S) E2 0 0 P # of species on island (S) 2 • Larger islands should have more species • Consistent with the species area relationship
The equilibrium model of island biogeography • Because travel to the near island is easier, the maximum immigration rate (I1), to • this island should exceed that of a more distant island (I2) I1 E Immigration rate (S) I2 0 0 P 1 # of species on island (S) 2 • Closer islands should have more species • Consistent with a distance effect
Summarizing the equilibrium model of island biogeography • The species richness of an island represents a balance between extinction and colonization • There is continual species turnover • Larger islands have a greater species richness at equilibrium • Islands closer to the mainland have a greater species richness at equilibrium I E1 Extinction rate (S) E2 0 0 P # of species on island (S) I1 E Immigration rate (S) I2 0 0 P # of species on island (S)
Tests of the equilibrium model • Is there evidence for a distance effect? • Is there evidence for species turnover? • Is there evidence for “relaxation” of diversity?
Evidence for a distance effect Birds of the Bismarck islands (Diamond, 1972) Species richness decreases with distance from New Guinea (mainland)
Evidence for species turnover: Insects on mangrove islands (Wilson and Simberloff 1969; Simberloff and Wilson 1969) • Identified 6 mangrove islands of varying size and distance from the mainland • Carefully censused the arthropod community of each island • Covered each island with canvas and fumigated to kill all arthropods • Tracked recolonization of the islands over several years Everglades National Park Photo
Evidence for species turnover: Insects on mangrove islands (Wilson and Simberloff 1969; Simberloff and Wilson 1969) • Species richness approached its pre-fumigation levels within 280 days • Species richness was greater on large islands closer to the mainland • Both results support the equilibrium theory of island biogeography but is there turnover? Species turnover is the critical test
Evidence for species turnover: Insects on mangrove islands (Wilson and Simberloff 1969; Simberloff and Wilson 1969) • Substantial species turnover occurred over the course of the experiment • Estimated the turnover rate to be .67 species per day! • Provides essential support to the equilibrium theory Black squares = species present Grey squares = species inferred to be present Taken together, these results support the equilibrium model
Evidence for relaxation of diversity • Does diversity decrease after geographic isolation? Initially, the land mass is cohesive Over time, a piece becomes isolated 14 Species 14 Species 14 Species
Evidence for relaxation of diversity • Pieces of mainland which become isolated should become less species rich over time and approach an equilibrium between immigration and extinction Immigration 14 Species 6 Species Time 14 Species 14 Species
Evidence for relaxation of diversity (Wilcox, 1978) • Studied lizard species # on former land bridge islands in the Gulf of California • Estimated the length of time these islands had been isolated • Plotted the relationship between time of isolation and number of species • Found evidence for “relaxation” of the lizard fauna • Consistent with the equilibrium theory
Applying equilibrium theory to reserve design (A practice problem) • You are tasked with selecting between three potential locations for a new national park • Your goal is to maximize the long term species richness of passerine birds within the park • Previous research has shown that the birds meet the assumptions of the equilibrium model 12km2 8km2 5km2 5km 4km 3km Mainland source pool: P = 36
Applying equilibiriumtheory to reserve design (A practice problem) Previous research has also shown that: • I = 2/x where x is distance to the mainland • E = .4/A where A is the area of the island • Which of the three potential parks would best preserve passerine bird species richness? 12km2 8km2 5km2 5km 4km 3km Mainland source pool: P = 36