Download
1 / 34
340 likes | 449 Views
Financial and Economic Profitability of Selected Agricultural Crops in Bangladesh. Institution: Department of Management and Finance Sher -e- Bangla Agricultural University (SAU) Principal Investigator: Dr Mohammad Mizanul Haque Kazal Department of Development & Poverty Studies SAU.

E N D
Financial and Economic Profitability of Selected Agricultural Crops in Bangladesh Institution: Department of Management and Finance Sher-e-Bangla Agricultural University (SAU) Principal Investigator: Dr Mohammad MizanulHaqueKazal Department of Development & Poverty Studies SAU
Background of the Study • Crop sector is the source of staple food for 150 million people • major source of livelihood for 16 million farm households. • The crop and horticulture sector jointly contributed US$9,643 million (11.3% of the GDP) • Financial profitability differs from economic (social) profitability because of distortions in the factor and product markets
Introduction • Trade and price policy • stability in food prices • input subsidy and output support • food security of the poor • strategic element for poverty alleviation
Objectives • To examine the financial and economic profitability of the various crops including an assessment of the comparative advantage for import substitution and/or export (i.e. conduct a standard PAM analysis). • To assess the impact of fertilizer subsidies on financial profitability and production and the factors leading to differences in financial and economic profitability across different crops and across different regions for the same crop. • To explain changing patterns of agricultural land use since 2000 based on different levels of financial profitability for different crops.
Research Design The study was designed to conduct into three phases Phase-Ideals with farm level survey, financial and economic cost and return analysis and assessment of comparative advantages of crops; Phase-IIdeals with assessing the impact of fertilizer subsidies on profitability using experimental data as well as farm-survey data for rice only; Phase-III measure the changing patterns of agricultural land use and identifies its socio-economic determinants using through the secondary time-series data.
Analytical Techniques Phase 1: Financial and economic profitability of the various crops AND an assessment of comparative advantage for import substitution and/or export 1. Financial and economic costs and returns from crops 2. Assessment of comparative advantage of crops Policy Analysis matrix (PAM) framework applied to measure economic efficiency and competitiveness under different production systems
Financial profitability of major crops Cost and return analysis is the most common method of determining and comparing the profitability of different farm enterprises. In estimating the level of profitability in crop production the following formula was used: ∏ = P1Q1 + P2Q2 - ∑PiXi– TFC Where, ∏ = Profit per hectare for producing the crop; P1 = Per unit price of the output; Q1 = Quantity of output obtained (per hectare); P2 = Per unit price of by-product; Q2 = Quantity of by –product obtained (per hectare); Pi = Per unit price of the ith input used for producing the crop; Xi = Quantity of the ith input used for producing the crop; and TFC = Total fixed cost.
Phase2: Assess the Impact of fertilizer subsidies on financial profitability and production This analyses was done by using two different approaches such as (1) by using the experimental data from BRRI, and (2) by using farm-survey data collected in Phase 1. Approach 1: Using experimental data from BRRI First step is to find the yield / profit maximizing level of N fertilizer use.
Approach 2: Using farm-survey data for rice crops only A profit function approach will be adopted to examine the impact of fertilizer subsidies on profitability of rice farming. The general form of the translog profit function, dropping the subscript for the farm, is defined as: The corresponding factor share equations are expressed as,
Phase 3: Socio-Economic and Environmental Determinants of Crop Diversity in Regions of Bangladesh (1990-2008) The study were used a model of crop choice in a theoretical framework of the farm household model applying a micro-econometric approach. • In this phase, • First, it was estimated the rate of change of individual crop area over time. • Next, it has been identified the determinants of land use of each crop over time. The study was computed growth rate of area cultivated for individual crop using semi-log trend function as follows:
Policy Analysis Matrix for rainfed Aman rice in southern region of Bangladesh (Average of 2010 and 2011):
Table. Actual and economic optimum levels of urea fertilizer per hectare
Table. Yield response function of rice using economically optimum dose of urea fertilizer
Table. Production elasticity of optimum dose of urea fertilizer.
Results indicate that the experimental level of urea fertilizer use is far lower than the economically optimum level of urea fertilizer for Aman and Boro seasons but higher for Aus season. The discrepancy is highest for HYV Boro rice where the profit maximizing level of N fertilizer dose is 232.4 kg/ha as compared to only 125.7 kg/ha. Also, production elasticity of HYV Boro rice is highest at 0.48, implying that a one percent increase in the optimum dose of N fertilizer will increase rice yield by 0.48% which is substantial. Changes in price of urea will exert some reduction in the optimum doses of urea fertilizer only in Aman season with no noticeable effect on Boro and Aus season.
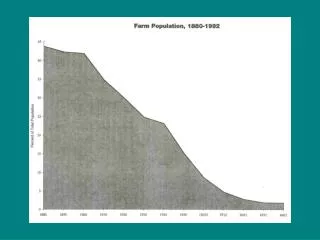
Table. Trends in cultivated area under different crop groups in Bangladesh
Figure. Shannon index of regional crop diversity in Bangladesh
Results demonstrate that other than area under modern rice, vegetables and spices, all other crop areas experienced significant decline at variable rates over time. • The level of crop diversity over time declined for most regions except Khulna and Sylhet. • In identifying the determinants of crop diversity, the results clearly reveal that a host of price and non-price factors influence farmers’ decision to diversify. • Among the prices, an increase in the relative prices of urea fertilizer and vegetables will significantly increase crop diversity. • In other words, a rise in urea price and vegetables relative to other prices will shift farmers to diversify their cropping portfolio.
Both extension expenditure and R&D investment significantly positively increases crop diversity which is very encouraging indeed and the government should seriously increase investment in these two policy amenable instruments. • A decline in wealth in terms of livestock induces farmers to switch to non-cereals that are not heavily dependent on draft power as these are grown on small scale by individual farms. • Switching to a diversified cropping system is labour intensive and our results show that increase in labour stock per farm allows farms to diversify. • Farmers also seem to respond to climate change as we see that variation in temperature as well as a reduction in total annual rainfall induces farmers to diversify their cropping system.