Download
1 / 22
220 likes | 339 Views
STAR. Run 8 FMS h -meson Transverse Single Spin Analysis Update. Len Eun July 2009 STAR Analysis Meeting. Previous observation of Single Spin Transverse Asymmetry for Forward Production of Eta Meson by FNAL Exp 704. 1. STAR. ,.

E N D
STAR Run 8 FMS h-meson Transverse Single Spin Analysis Update Len Eun July 2009 STAR Analysis Meeting
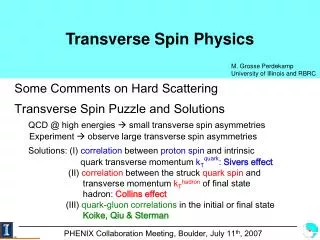
Previous observation of Single Spin Transverse Asymmetry for Forward Production of Eta Meson by FNAL Exp 704. 1 STAR , • Nominally (perhaps not significantly) larger asymmetry for Eta than Pi0. • Large Uncertainty in Eta AN. 2
2 Di-Photon Center of Mass (EN&ES) STAR h mass region with Center Cut in red p0 mass region with Center Cut in black Event Selection for Run6 FPD h analysis • Event Cuts • 2 photon events • Etotal>25GeV • Hardware threshold nominally at 25GeV • “Center Cut” for 2g CoM defined as • Etot: Detector summed energy • Zgg and photon separation: Fitted photon energy/locations • Reconstructs on the entire FPD • Vertex set at zero for all events
3 STAR h and p0 Zgg Distribution for Run6 FPD p0 mass region with Center Cut Eta mass region with Center Cut Nevents Zgg Zgg
4 STAR p0 Mass Cut Eta Mass Cut Observation of Eta Signal in Run6 FPD Di-Photon Invariant Mass Spectra in 3 Energy Bins • Center Cut • 3 columns for 3 energy bins • Each column shows a single plot in log and linear scale. AN(xF) will be reported for di-photon events in these two shaded mass regions. We will not separate contributions from backgrounds under the Eta and p0 peaks.
5 STAR STAR 2006 PRELIMINARY Mass Dependence of in AN Run6 FPD • Nphoton = 2 • Etotal > 40GeV • No Center Cut • Average Yellow Beam Polarization = 56% • Yellow beam asymmetry clearly reveals the shape of two mass resonances. • There is an “asymmetry valley” in between p0 and Eta mass regions.
6 STAR For , the asymmetry in the Eta mass region is greater than 5 sigma above zero, and about 4 sigma above the asymmetry in the p0 mass region. AN(xF) in p0 and Eta Mass Regions in Run6 FPD • Nphoton = 2 • Center Cut (h and f) • Pi0 or Eta mass cuts • Average Yellow Beam Polarization = 56%
7 STAR Run8 FMS Transverse SSA Analysis for h • The data covers 392 runs, from 9057004 to 9070007. This is the same run list used for Spin08 transverse spin analysis. • Preliminary Spin08 cell by cell gain corrections are used. • NO ENERGY CORRECTION IS USED. The energy dependent mass shift in FMS is much more severe than what we saw in the FPD. We are in the process of investigating this feature, but currently we do not have satisfactory correction factors. If asymmetry has a steep slope as a function of xF, as suggested by the run6 measurement at high xF, energy scale becomes extremely crucial in quantifying the AN. • Minimum energy for photon is 3GeV. This is to reduce the side effect of high tower trigger. • Cluster algorithm with fixed radius in Eta-Phi plane is used for identifying photon pairs. The radius used for the following analysis is 0.6 unless noted otherwise. • The reconstruction algorithm used here is essentially the same as what we used in the FPD. This point perhaps needs further investigations.
8 STAR Run8 FMS Acceptance for p0 and h Azimuthal Angle vs. Pseudo-Rapidity for p0 and h mass region for Egg>55GeV and Z<0.7 0.1<Mgg<0.2 0.5<Mgg<0.7 For Run8 transverse data, the uniformity of FMS acceptance was significantly limited by the combination of high tower trigger and uneven phototube gains. This non-uniformity persists to higher energy, as some of the cells had extremely high effective trigger threshold. Unfortunately for transverse physics, the hot regions tended not to be along the horizontal axis.
9 STAR Run 8 FMS Trigger Analysis In run 8, a simple high tower algorithm was used for trigger. The thresholds were 400ADC counts for the small cells, and 200ADC counts for the large cells. The nominal gain was targeted at (as I understand) 40ADC counts per GeV. The actual gains varied greatly from the nominal value, and the trigger ended up coming largely from relatively small number of cells.
10 STAR Zgg(Energy Sharing) Distribution for Run8 FMS Egg vs. Zgg Zgg Distributions for p0 and h mass regions The effect of high tower trigger is very clear in the Z distribution. With the FPD, the h acceptance was at low Z due to the physical size of the detector. With the FMS, statistics mostly come from high Z end. Nevertheless, we use Z < 0.7 cut as it has been done with most of the FPD analysis to suppress the background.
11 STAR Dataset Comparison to Run6 FPD Pseudo-FPD cut Both photons within the physical boundaries of the FPD at far position. The center of mass of the photon pair passes the Run6 “center-cut.” Egg > 25GeV to emulate FPD trigger. Red points indicate all two photon events in h-mass region with E>55GeV and Z<0.7 The black points are the subset of these events that pass the pseudo-FPD cut. (They are not real FPD data!) We see very little overlap.
12 STAR STAR 2006 PRELIMINARY Pseudo-rapidity Cut for h Signal For all following plots, we use 3.45 < Pseudo-Rapidity < 3.8 to enhance the h peak relative to the “valley” region in between the p0 and h.
13 STAR Mgg for Egg > 40GeV Log scale Linear scale The fits are purely ad-hoc. They are just for the purpose of illustrating the general possible shape of the high mass background. Simulation will come. Cluster radius 1.2 in Eta-Phi Cluster radius 0.6 in Eta-Phi
14 STAR Energy Dependence in Run8 FMS For run8 FMS, we see the mass peak shifting as much as 20% going from 40GeV to 80GeV. This is in sharp contrast to the energy dependence we saw in the FPD, which was on the order of ~1% per 10GeV. Mcut2 Mcut1 Run8 FMS Mgg spectrum in E bins Run6 east FPD energy dependence
15 STAR Average Cosine Phi for Run8 FMS For the following calculations of raw asymmetry, we use cross ratio weighted by average cosine Phi. The plot above shows M=0.135+-0.08, and does not have the pseudo rapidity cut.
16 STAR Raw AN vs. Mgg for Egg > 55GeV
17 STAR Raw AN vs. xF, 0.51 < Mgg < 0.65 Red points are for 0.09 < Mgg <0.17. The p0 asymmetry is not very sensitive to the mass cut. For h mass region, 0.51 < Mgg < 0.65 is used, which is roughly symmetric around the peak at E = ~50GeV. Blue points represent the asymmetry in this mass region.
18 STAR Raw AN vs. xF, 0.51 < Mgg < 0.56 Now we try a much narrow mass cut, targeted to enhance the asymmetry. At higher xF, this mass region falls off the mass peak. Interestingly, it shows similar patterns for positive and negative xF.
19 STAR What’s Next? We are in the early stage of the analysis. Clearly there are many questions to answer in order to understand this first year data of the FMS. Understanding the energy scale in the FMS is the crucial next step. Full detector simulations are needed to understand why and how FMS differ from the FPD in this regard. Pythia can help us understand the background mass spectrum at higher mass region, to the extent that it knows about the forward particle spectrum. (which may not be a whole lot)
8 STAR
8 STAR FMS vs. pseudo-FPD