Download

1 / 20
200 likes | 316 Views
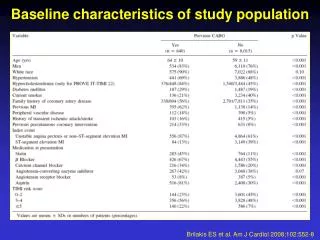
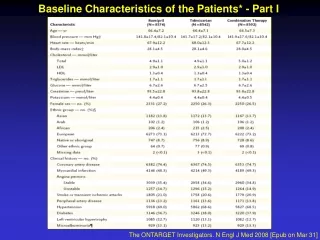
Baseline characteristics. Registered 13 655. Not randomised 1 437. Randomised 12 218. Perindopril 6 110. Placebo 6 108. Completed 6 108. Completed 6 107. Patient flow. 141. 176. 57. 115. 134. 130. 2068. 94. 1772. 300. 277. 1251. 197. 2176. 209. 399. 65. 285. 830.

E N D
Registered 13 655 Not randomised 1 437 Randomised 12 218 Perindopril 6 110 Placebo 6 108 Completed 6 108 Completed 6 107 Patient flow
141 176 57 115 134 130 2068 94 1772 300 277 1251 197 2176 209 399 65 285 830 22 890 102 17 511 424 centres : 12 218 patients
% Intolerance Hypotension Creatinine/Potassium rise Poor compliance Major clinical event Non medical reasons Unspecified 2.4 2.1 1.1 0.6 0.5 0.5 3.3 Overall: 1 437 of 13 655 pts 10.5 Not randomised
14 12 10 8 6 RRR: 20% 4 p = 0.0003 2 0 1 0 2 3 4 5 Primary endpoint % CV death, MI or cardiac arrest Placebo Perindopril Years Placebo annual event rate: 2.4%
Placebobetter Perindoprilbetter RRR (%) 20 CV mortality, MI, CA CV mortality 14 Non fatal MI 22 Cardiac arrest 46 Total mortality, MI, UAP,CA 14 0.5 1.0 2.0 Primary and first secondary endpoint
RRR (%) Perindopril better Placebo better Male 19.3 Female 22.0 Age 56 yrs 27.3 Age 57 - 65 14.3 Age > 65 yrs 18.2 Previous MI 22.4 No previous MI 12.1 0.5 1.0 2.0 Sub-groups analysis
RRR (%) Perindoprilbetter Placebobetter Hypertension 18.6 No hypertension 19.9 Diabetes mellitus 18.9 No diabetes mellitus 19.0 Stroke/TIA 15.8 No stroke/TIA 19.9 2.0 0.5 1.0 Sub-groups analysis
Perindoprilbetter Placebobetter RRR (%) Lipid lowering drug 16.3 No lipid lowering drug 22.3 -blockers 26.4 No -blockers 7.0 Calcium blockers 15.8 No calcium blockers 22.2 0.5 1.0 2.0 Sub-groups analysis 92% patients on platelet inhibitors
RRR (%) Perindopril better Placebo better 14.0 Total mortality, MI, UAP,CA 19.3 CV mortality & MI 17.4 CV mortality, MI & stroke 11.3 CV mortality, MI, revascularisation 15.5 CV mortality, MI, unstable angina 16.5 Fatal & non fatal MI, unstable angina 23.9 Non fatal and fatal MI 11.0 Total mortality 13.9 CV mortality 7.1 Unstable angina 45.6 Cardiac arrest 4.3 Stroke 4.2 Revascularisation 39.2 Heart failure 0.5 1.0 2.0 Secondary endpoints
RRR: 24% 10 p < 0.001 8 6 4 2 0 Years 0 1 2 3 4 5 Fatal and non fatal MI (%) Placebo Perindopril
RRR: 39% (%) 2.0 p = 0.002 1.5 1.0 0.5 0.0 Years 0 1 2 3 4 5 Hospitalisation for heart failure Placebo Perindopril
Perindopril 8mg Placebo 140 mmHg 130 120 110 100 90 80 70 -1 -1/2 0 3 6 12 18 24 30 36 42 48 54 60 Months Blood pressure SBP: 5 mmHg DBP: 2 mmHg
(%) 120 100 80 60 Placebo 40 Perindopril 8mg 20 0 0 6 12 18 24 30 36 Months Adherence to treatment