Download
1 / 9
90 likes | 160 Views
Computer gestützte "Go/NoGo" Geländeanalysen Vorläufige Ergebnisse einer Testauswertung mit e.cognition 5 und TreesVIS Dr. R. de Kok Dr. M. Weidenbach 12/2006 l a n d C o n s u l t . d e Geographic Information on Demand Spannstattstr. 40 D 77773 Schenkenzell

E N D
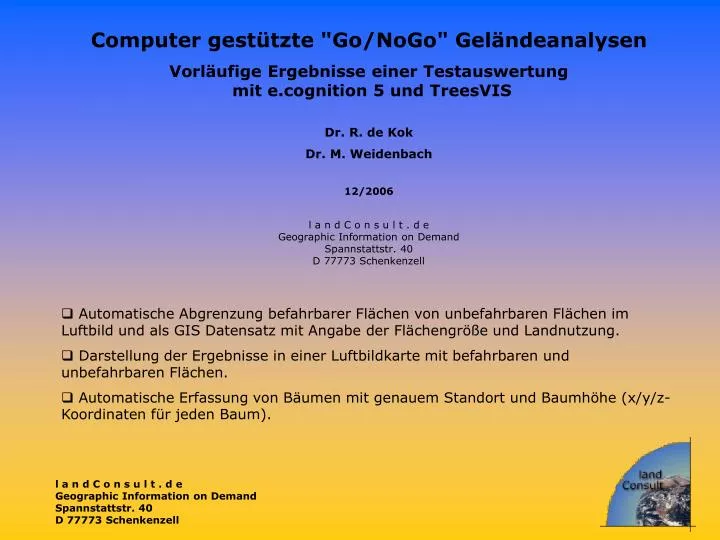
Computer gestützte "Go/NoGo" Geländeanalysen • Vorläufige Ergebnisse einer Testauswertung mit e.cognition 5 und TreesVIS • Dr. R. de Kok • Dr. M. Weidenbach • 12/2006 • l a n d C o n s u l t . d e • Geographic Information on Demand • Spannstattstr. 40 • D 77773 Schenkenzell • Automatische Abgrenzung befahrbarer Flächen von unbefahrbaren Flächen im Luftbild und als GIS Datensatz mit Angabe der Flächengröße und Landnutzung. • Darstellung der Ergebnisse in einer Luftbildkarte mit befahrbaren und unbefahrbaren Flächen. • Automatische Erfassung von Bäumen mit genauem Standort und Baumhöhe (x/y/z-Koordinaten für jeden Baum). l a n d C o n s u l t . d e Geographic Information on Demand Spannstattstr. 40 D 77773 Schenkenzell
Abb. 1: Original RGB Orthophoto aus Bild/Laserflug l a n d C o n s u l t . d e Geographic Information on Demand Spannstattstr. 40 D 77773 Schenkenzell
Abb. 2: Hochaufgelöstes Geländemodell aus Laser Punktwolke generiert (blau = tief, rot = hoch) l a n d C o n s u l t . d e Geographic Information on Demand Spannstattstr. 40 D 77773 Schenkenzell
Abb. 2: Auswertung der First Pulse Laserdaten zur Darstellung des Oberfächenmodells (dunkelgrün = hoch, blau = ohne Echo, z.T. Wasserflächen). l a n d C o n s u l t . d e Geographic Information on Demand Spannstattstr. 40 D 77773 Schenkenzell
Abb. 3: Differenzmodell aus First Pulse und Last Pulse Laserdaten l a n d C o n s u l t . d e Geographic Information on Demand Spannstattstr. 40 D 77773 Schenkenzell
Abb. 4: Kantendetektion aus Bild- und Laserdaten generiert l a n d C o n s u l t . d e Geographic Information on Demand Spannstattstr. 40 D 77773 Schenkenzell
Abb. 5: Automatisierte Erfassung und Darstellung von Gebäuden (rot) und Bäumen (grün) als Teil der "NoGo" Bereiche, d.h. des nicht passierbaren Geländes. l a n d C o n s u l t . d e Geographic Information on Demand Spannstattstr. 40 D 77773 Schenkenzell
Abb. 5a: Automatisierte Erfassung und Darstellung von Gebäuden (rot) und Bäumen (grün) als Teil der "NoGo" Bereiche, d.h. des nicht passierbaren Geländes. l a n d C o n s u l t . d e Geographic Information on Demand Spannstattstr. 40 D 77773 Schenkenzell
Abb. 6: Automatisierte Erfassung und Darstellung der "GO" Bereiche, d.h. des befahrbaren Geländes (im Bild mit weißen Punkten dargestellt). l a n d C o n s u l t . d e Geographic Information on Demand Spannstattstr. 40 D 77773 Schenkenzell