Download
1 / 23
230 likes | 439 Views
Risk Factors for Children in the U.S., States, and Metropolitan Areas: Data from the 2007 American Community Survey. Robert Kominski, U.S. Census Bureau Diana B. Elliott, U.S. Census Bureau Molly Clever, University of Maryland Session 186: ACS in Applied Demography PAA – 2009 Annual Meeting

E N D
Risk Factors for Children in the U.S., States, and Metropolitan Areas: Data from the 2007 American Community Survey Robert Kominski, U.S. Census Bureau Diana B. Elliott, U.S. Census Bureau Molly Clever, University of Maryland Session 186: ACS in Applied Demography PAA – 2009 Annual Meeting Detroit, Michigan
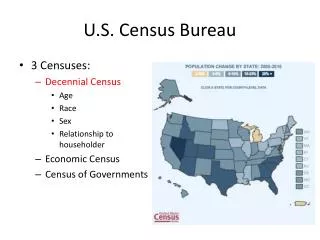
Estimating Child Well-Being • Lots of research efforts • Annie E. Casey, Child Trends, Federal Interagency Forum • Foundation for Child Development/Ken Land • Many data sources – some integrated, some not
What is the goal? • Portraying the status of children • Use indicators – link to “domains” • Some summarize scores (102.5), others do not • See variability over groups, time and space • Geography is a problem – US is often the best we can do
Geographic Specificity • Very few data systems at sub-national level • Some sub-national data in administrative systems • But – these sometimes lack definitional comparability
Solution? • Consistent data source • Wide variety of measures • Collected routinely • For various subgroups • Across various levels of geography American Community Survey (ACS)?
ACS • Part of redesigned 2010 decennial census • Long-form data moved to continuous data collection • 250,000 households/month in sample • Yearly data/estimates for geographic units of 65,000+ (7000) • 3- and 5-yr collections for smaller units (20,000+, tracts) • Data reissued ANNUALLY
This Study • Data from the 2007 ACS • 1,055,000 sample kids (73,590,243 weighted), ages 0-17 • Households and Group Quarters • Data for all States and 363 Metro Areas 65K+ • Those 363 MSA’s are 84% of all kids 0-17
Indicators • No data set is fully complete • Identified 22 items in ACS data • Focus on ‘risk’ – conditions that might negatively affect children • Four domains: Individual; Familial/Household; Economic; Physical Environment • Some subjectivity and redundancy
Figure 1: Number of Children by Number of Risk Factors (2007), in millions Number of Children, in millions Number of Risk Factors Source: U.S. Census Bureau, American Community Survey, 2007
Figure 2: Percentage of Children with Each Risk Factor (2007) Individual Familial/HH Economic Phys Environ. Source: U.S. Census Bureau, American Community Survey, 2007
Figure 3: Mean Risk Factors for Children by Selected Social Characteristics (2007) 2.18 - Boys Sex 2.18 - Girls 2.37 – 0 to 4 year olds 2.27 – 5 to 9 year olds Age Group 2.06 - 10 to 13 year olds 1.96 - 14 to 17 year olds 1.68 - White 3.24 – Black 3.25 – Amer. Ind./Alaska Nat. Race 2.54 - Asian 3.08 – Nat. Hawaiian/Pac. Isl. 4.03 – Other race 2.29 – Two or more races 1.77 - Not Hispanic Hispanic 3.75 - Hispanic U.S. Mean: 2.18 Source: U.S. Census Bureau, American Community Survey, 2007
Figure 4: Percentage of Children with No Risk Factors by Selected Social Characteristics (2007) 31.4% - Boys Sex 31.7% - Girls 28.0% - 0 to 4 year olds Age Group 31.9% - 5 to 9 year olds 33.7% - 10 to 13 year olds 33.3% - 14 to 17 year olds 40.0% - White 13.1% – Black 12.3% – Amer. Ind./Alaska Nat. Race 19.2% - Asian 9.8% – Nat. Hawaiian/Pac. Isl. 6.5% – Other race 25.7% – Two or more races 37.4% - Not Hispanic Hispanic 9.1% - Hispanic Source: U.S. Census Bureau, American Community Survey, 2007 U.S.: 31.5%
Figure 5: Percentage of Children with 8 or More Risk Factors by Selected Social Characteristics (2007) 3.0% - Boys Sex 3.0% - Girls 2.7% - 0 to 4 year olds Age Group 3.8% - 5 to 9 year olds 3.0% - 10 to 13 year olds 2.5% - 14 to 17 year olds 1.9% - White 4.0% – Black 4.2% – Amer. Ind./Alaska Nat. Race 4.1% - Asian 5.4% – Nat. Hawaiian/Pac. Isl. 10.0% – Other race 2.4% – Two or more races 1.5% - Not Hispanic Hispanic 8.6% - Hispanic U.S.: 3.0% Source: U.S. Census Bureau, American Community Survey, 2007
Mean risk factors: States and Metros Metros States U.S. Mean: 2.2 Source: U.S. Census Bureau, American Community Survey, 2007
No risk factors: States and Metros Metros States U.S. Average: 31.5% Source: U.S. Census Bureau, American Community Survey, 2007
8+ risk factors: States and Metros Metros States U.S. Average: 3.0% Source: U.S. Census Bureau, American Community Survey, 2007
Individual risk factors: States and Metros Metros States U.S. Average: 17.0% Source: U.S. Census Bureau, American Community Survey, 2007
Familial and household risk factors: States and Metros Metros States U.S. Average: 52.0% Source: U.S. Census Bureau, American Community Survey, 2007
Economic risk factors: States and Metros Metros States U.S. Average: 27.1% Source: U.S. Census Bureau, American Community Survey, 2007
Physical risk factors: States and Metros States Metros Less than 40% U.S. Average: 44.1% 40.0 to 49.9% 50.0 to 54.9% 55.0 to 59.9% 60% or more Source: U.S. Census Bureau, American Community Survey, 2007
Summary • Analysis shows risk is not evenly distributed across groups or space • High geography (state) hides variability at lower levels (metros) • While the ACS is not perfect, content comparability, geographic specificity and temporal regularity are BIG plusses
Contact Information U.S. Census Bureau Housing and Household Economic Statistics Division Robert Kominski robert.a.kominski@census.gov Diana B. Elliott diana.b.elliott@census.gov