Download
1 / 38
380 likes | 501 Views
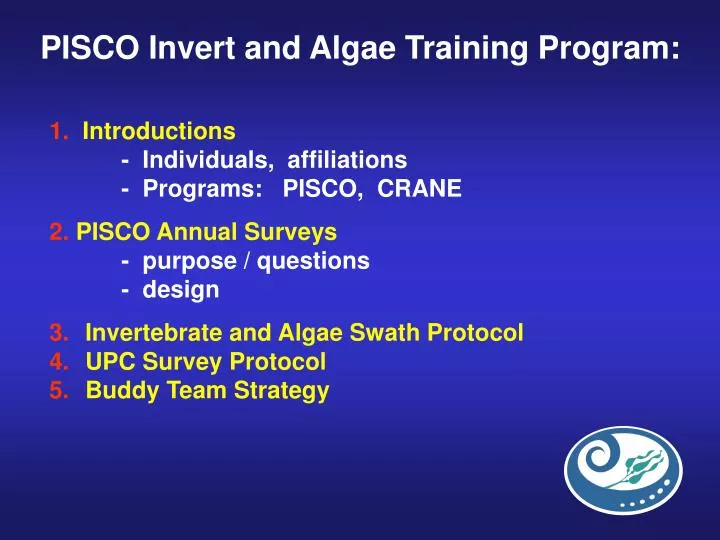
PISCO Invert and Algae Training Program:. 1. Introductions - Individuals, affiliations - Programs: PISCO, CRANE 2. PISCO Annual Surveys - purpose / questions - design Invertebrate and Algae Swath Protocol UPC Survey Protocol Buddy Team Strategy. P artnership for

E N D
PISCO Invert and Algae Training Program: • 1.Introductions • - Individuals, affiliations • - Programs: PISCO, CRANE • 2.PISCO Annual Surveys • - purpose / questions • - design • Invertebrate and Algae Swath Protocol • UPC Survey Protocol • Buddy Team Strategy
Partnership for Interdisciplinary Studies of Coastal Oceans Consortium of 4 research universities: • Oregon State University • UC Santa Cruz • Stanford – Hopkins Marine Station • UC Santa Barbara Funded by: David and Lucile Packard Foundation, Department of Interior, State of California Gordan and Betty Moore Foundation
Objectives of PISCO To initiate and maintain: • A long-term, large scale-ecological study of • patterns and processes • An unprecedented interdisciplinary effort to study coastal reef ecosystems (e.g., ecologists, physical oceanographers, • physiologists, geneticists) • Communication between scientists, managers, policy-makers, and user groups • A novel interdisciplinary training program
Annual Kelp Forest Surveys Purposes (questions) 1. To describe patterns of annual and spatial variability of populations, community structure, kelp forest ecosystems; 2. To identify the potential role of variation in: - habitat features (e.g., substrate type, relief) - species interactions - oceanographic conditions (e.g., exposure, El Nino) - human activities (fishing, runoff) in explaining observed spatial and temporal patterns
Annual Survey Design When July-October (early=invertebrate and algae; mid-season: benthic and midwater fish; later=canopy fish) Where • Different oceanographic regimes • North and south of Monterey Bay • Carmel Bay • Big Sur coast - Cayucos • Above, below, and at Pt Conception break • Channel Islands • 2. Marine reserves and “paired” comparison sites • Hopkins MLR • Pt Lobos • Big Creek • Channel Islands Marine Reserves
California Current California Pacific Ocean California Counter Current
UCSC Subtidal Monitoring Sites by Year Sampling Began 1999 2000 2001 2002 2003
5 m 10 m 5 m 15 m 12 m 20 m 20 m Within-site Sampling Design Coastline Fish transect distribution Algae / invertebrate transect distribution
Annual Surveys Spatial Sampling Design • Spatial (depth) stratification: • Shallow (S) = 5 m, Mid (M) = 12.5 m, Deep (D) = 20 m • designed to assure that all depth zones are representatively sampled for description of invert and algae assemblages. • 2. Also to assure representative sampling from outer to inner edges of the reef! • 3. If reef depths are constrained (e.g., 5-10 m), then sampling is distributed from outer to inner edges of reef including comparable depths (when possible) to those above (e.g., 5 and 10 m), plus additional depth strata to assure coverage from inner to outer edges of the reef.
Annual Surveys - Spatial Sampling Design 4. Narrow reefs (inner to outer or across depth strata) are sampled with increased within-stratum replication (i.e. more than 3 transects per stratum per area (to approximate the usual 24 transects per site). This allows us to compare: A) Population densities and assemblage structure at similar depths throughout the range of the project (i.e. southern, central and northern CA), and B) Populations and assemblages between reefs with similar sampling intensity. 5. Important that same depth (or inner-outer) strata are sampled every year, regardless of location of kelp forest. This allows us to document dynamics of kelp forest coverage (inner to outer) within and between sites and how the species distribution responds to changes in kelp distribution.
Annual Surveys - Overall Sampling Design 1999 …… 200n Time Site 1 2 3 25 …… 1 2 Area Zone (5 m, 12.5 m, 20 m) S M D Transects: 2
Annual Surveys Invertebrate and Algae Swath Transects Which species are sampled? Ecologically important invertebrates representing a variety different ecological roles Herbivore Planktivore Predator Detritivore Photos: Lonhart/MBNMS
Species of Economic Importance King/MBNMS Efird Lonhart/MBNMS
1 meter 1 meter Swath Surveys Swaths should extend one meter on either side of the transect line. Top view of transect Transect line Maintain reasonable speed (~20 minutes per transect) and only count invertebrates 2.5 cm or larger in diameter.
SUB-SAMPLING in each 10m segment Once 30 individuals of a species are counted, indicate how many meters you have sampled within the 10 m segment (NOT THE METER MARK!) and discontinue counting until you reach the next 10m segment. Indicating the meter mark causes much discrepancy, because you will not always swim a transect in the 0-30m direction.
Use a flashlight at all times when surveying for swath invertebrates to make sure organisms in cracks and crevices are accounted for.
>6cm Algae are also counted using Swath techniques. Count all individuals 30 cm or larger, except Macrocystis and Nereocystis (>1 m) and Cystoseira (>6 cm diameter). 1m Efird
UPC Surveys Uniform Point Contact Data are collected every 0.5 meter for 30 meters. Top view of transect Transect line 0.5 meter Transect tapes are marked at 0.5 meter increments for sampling ease.
UPC Surveys Uniform Point Contact Data are collected every 0.5 meter for 30 meters. Top view of transect Transect line 0.5 meter Transect tapes are marked at 0.5 meter increments for sampling ease.
Each 10 meter segment contains20 data pointsfor each of three catagories: Substrate Relief (Superlayer) Point
Lonhart/MBNMS If your point falls on a mobile invertebrate or epibiont, make sure you are recording the organism underneath it that isdirectly attached to the substrate.
Efird How to correctly identify the categories of ‘substrate’ and ‘point’ will be covered during the identification portion of this class.
The SUPERLAYER category is tallied only when algae- either drift or Laminaria farlowii- lies over the primary substrate holder. After marking the presence of the superlayer, move the algae and record the primary substrate holder. Figurski Figurski Oftentimes, drift will not be encountered. It is therefore important to check the ‘Looked for’ box, so that an absence of data points can be differentiated from when it has not been looked for.
Reliefis the absolute difference in elevation between the highest and lowest point within a 1 meter by 0.5 meter rectangle. Top view of transect Transect line 1 meter 0.5 meter
Reliefis the absolute difference in elevation between the highest and lowest point within a 1 meter by 0.5 meter rectangle. Top view of transect Transect line 1 meter 0.5 meter The rectangle is centered on the UPC point, and the areas do not overlap.
Reliefis the absolute difference in elevation between the highest and lowest point within a 1 meter by 0.5 meter rectangle. End-on view of transect 1 meter 1 meter Greatest vertical distance 1 meter (10 cm-1 m) 2 meters (>2 m) Transect line Transect line
UPC Surveys Uniform Point Contact Remember not to bias your data! Use an imaginary long, sharp, steel rod (or lightning bolt) to place your point. Transect line
Benthic Transect Strategy For Benthic surveys, the UPC diver and Swath diver work along a single transect tape.
Benthic Transect Strategy The UPC diver swims the transect tape out the entire 30 meters along the depth contour, without taking data. The Swath diver begins taking data along the meter tape.
Benthic Transect Strategy The UPC diver secures the meter tape at the end and begins taking data in the reverse direction along the transect.
Benthic Transect Strategy The Swath diver completes the 30 m invertebrate transect and begins to swim in the reverse direction taking algae swath data.
Benthic Transect Strategy When the UPC diver reaches the end of the 30 meter transect, they begin taking algae swath data back towards the Swath diver.
Benthic Transect Strategy Once they meet along the meter tape, one diver returns to the end and reels up the tape. Divers then proceed to the next transect by swimming about 10 meters opposite of the starting direction.
For invertebrates and algae for which individuals can be counted separately, sampling along SWATHs produces estimates of density (# individuals/area).For invertebrates and algae for which individuals cannot be counted separately, UNIFORM POINT CONTACT produces estimates of percent cover.SWATH surveys encompass a 30 meter by 2 meter band.UPC surveys describe a series of discrete points along a 30 meter transect.Throughout sampling procedure, divers must assure safety by communicating as much as possible. Summary