Download
1 / 17
170 likes | 179 Views
Learn how to graph linear inequalities in two variables and determine if there is a solution or not. This tutorial explains the steps to graph inequalities and provides examples.

E N D
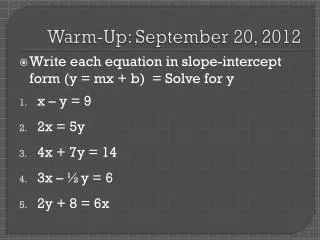
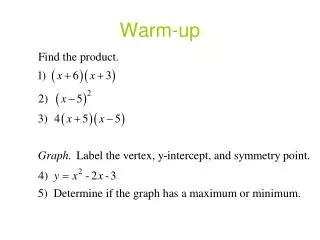
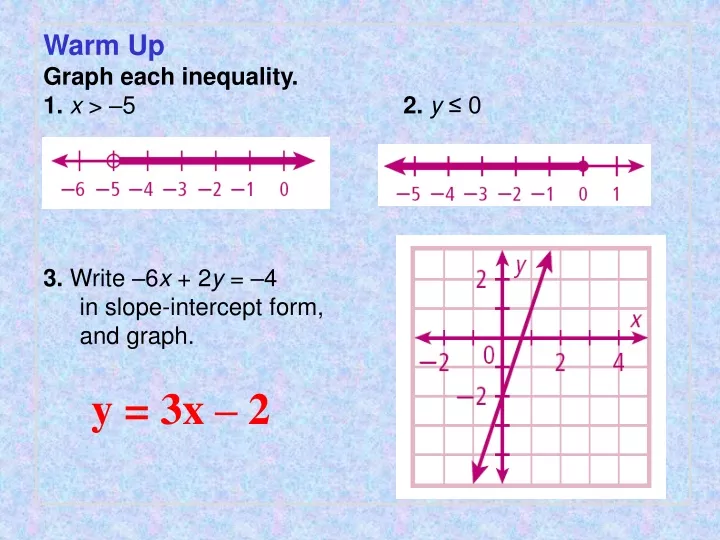
Warm Up Graph each inequality. 1. x > –5 2.y ≤ 0 3. Write –6x + 2y = –4 in slope-intercept form, and graph. y = 3x – 2
Step 2 Slope = Count 2 units down and 5 units right from (0, 4) and plot another point. Graphing by Using Slope and y-intercept Graph the line given the slope and y-intercept. y intercept = 4 y • Rise = –2 • • Step 1 The y-intercept is 4, so the line contains (0, 4). Plot (0, 4). • Run = 5 Step 3 Draw the line through the two points.
Graphing Linear Inequalities Four simple things to remember! • A dotted line is like an open circle (< or >) • A solid line is like a closed circle (< or >) • “Greater than” is above ground • “Less than” is below ground Okay then, here we go…
A linear inequality in x and y is an inequality that can be written as follows. ax + by < c ax + by ≤ c ax + by > c ax + by ≥ c • The graph of a linear inequality in two variables is the graph of the solutions of the inequality. • A line divides the coordinate plane into two half-planes. The solution of a linear inequality in two variables is a half-plane.
Graphing a Linear Inequality • Graph the corresponding equation (in slope-intercept form). • Use a dashed line for inequalities with > or < to show that the points on the line are NOT solutions. • Use a solid line for inequalities with ≥ and ≤ to show that the points on the line ARE solutions.
The line you drew separates the coordinate plane into two half-planes. Test a point in one of the half-planes to find whether it is a solution of the inequality. • If the test point IS a solution, shade the half-plane it is in. If not, shade the other half-plane. (Hint: If it is > or ≥, you will shade above the line. If it is < or ≤ you will shade below the line)
Sketch the graph of the Inequality 3x – y > 5 First solve for y -y > -3x + 5 y < 3x – 5 Graph the equation like y = 3x – 5 except use a dotted line for the graph. Substitute (0,0) in the equation. 0< 3(0) – 5 0 < -5 False “Shade” the half-plane that does not include (0, 0)
Sketch the graph of the Inequality -x + y ≤ 3
Sketch the graph of the Inequality 9x – 3y < 18
Sketch the graph of the Inequality y – 5x ≥ 0