Download
1 / 9
90 likes | 210 Views
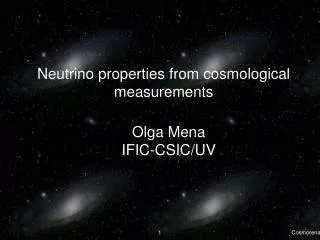
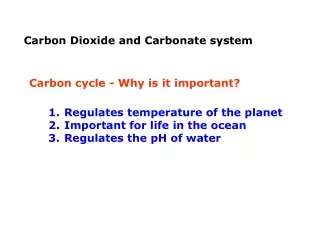
Measurements of the carbonate system properties. Franck Touratier & Catherine Goyet Lab. IMAGES Université de Perpignan Via Domitia. Global warming. Stratification Circulation. Greenhouse effect. ?. Inorganic Carbon Chemistry. Organic Carbon Biology. ?. Anthropogenic CO 2.

E N D
Measurements of the carbonate system properties Franck Touratier & Catherine Goyet Lab. IMAGES Université de Perpignan Via Domitia
Global warming Stratification Circulation Greenhouse effect ? Inorganic Carbon Chemistry Organic Carbon Biology ? Anthropogenic CO2 Acidification
Scientific background: • Measurements of CT and AT during the WOCE program
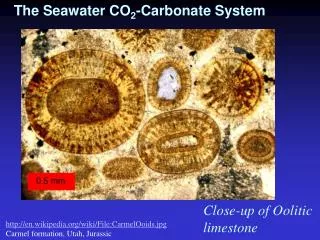
Concerning the MediterraneanSea … • Why the Med. Seaissointeresting? • 1) Because the Med. Seaischaracterized by a veryhighanthropogenic pressure; 2) the ventilation of the deep waters isvery intense; 3) Someconsequences of the climate change has been observed (EMT); 4) itisbelievedthat the level of Cant (and consequently the acidification level) is one of the highest in the world ocean; 5) The Med. Seaacts as a source of C for the Atlantic. • OverallObjective:is to build up a database of the carbonate system properties (CT, AT, pH, pCO2) for the whole Med. Sea in order to • 1) estimate Cant sequestrationefficiency; and 2) to estimate the level of acidification the potential impact(s) on the biology. • A serious limitationcomesfrom a verypoor data coverage in thisregion! For instance, in the Medatlasdatabase : CT data are absent and there are large uncertainties on AT. • One objective of IMAGES is to gatheravailable data of good quality, to acquire new samples, and performaccuratemeasurements of the CO2/carbonate system.
. . . . SARHYGOL Feb-Dec/2001 . BOUSSOLE/AOPEX Jul-Aug/2004 . METEOR 51/2 Oct-Nov 2001 (University of Kiel, Germany) .Cruises off Alger (ISMAL) 2006 . EMED-BIOPT Sept/2006 . SEMANE Jul/2002 .TSS DYFAMED & SOLA . RHOFI Jul/2003
2) Scientific objectives: I.To extend our knowledge on the distribution of the properties of the carbonate system using measurements of CT and AT II. To estimate Cant (TrOCA approach; Touratier et al., 2007) and acidification level (pH) local estimation with lowered uncertainties, S AT Cant pH O2 CT III. To estimate at the global Mediterranean scale Cant (TrOCA) and acidification using an interpolation procedure from S, , and O2 (Goyet and Davis, 1997) . CT = a + bS + c + dAOU; AT = f (S)
EMED-BIOPT 2006 CT (µmol.kg-1) AT (µmol.kg-1) Cant (µmol.kg-1) pH
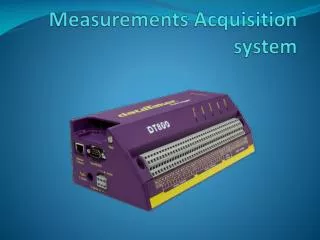
3) How to reachthese objectives: • Samples for AT and CT should be collected from surface to the bottom, but preferentially below the MLD, • In order to estimate Cant and pH, the O2 concentration should be measured in the same samples. 4) Specificneeds on board: • Space on board to store samples: • number of samples must be first estimated • 20 samples/box each box is 0.072 m3 • Ideal temperature for storage is 4°C but samples may support higher temperatures (5-25°C) for several weeks. • The room for storage should be situated close to the CTD deck • Each sample requires 1.5 litre of seawater and samples must be collected just after those for oxygen analysis to minimize CO2 exchanges.