Download
1 / 40
410 likes | 596 Views
Population Size, Population Growth, and Environmental Impacts. Population Size, Population Growth, and Environmental Impacts. Why should we think about population size and growth I = P A T Ecological Footprints Trends in human population growth Slowing human population growth

E N D
Population Size, Population Growth,and Environmental Impacts
Population Size, Population Growth,and Environmental Impacts • Why should we think about population size and growth • I = P A T • Ecological Footprints • Trends in human population growth • Slowing human population growth • Is dealing with population size worth the effort?
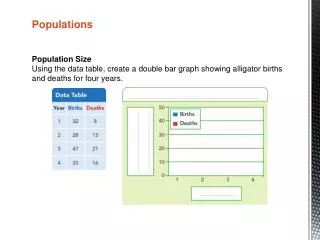
Sustainability • I = P A T (after Holdren & Ehrlich 1974) • Environmental Impacts = (Population size) x (Affluence) x (Technology) • Population size = number of people, often expressed per unit area (population density) • Affluence = per capita consumption • Technology = environmental damage resulting from each unit of consumption
Impacts: an example • How far did your breakfast travel to reach you this morning?
Breakfast travels • What do you need to know? • What did you eat for breakfast? • What ‘raw materials’ make up your breakfast? • The basic questions: • Where were they produced? • How were they produced? • How may people were involved in their production? • How much energy was used in their production? • What waste materials were generated in the production?
Breakfast travels • What do you need to know (continued)? • How were they processed (repeat the basic questions) • By what means were they assembled into breakfast products (repeat the basic questions) • How did the breakfast products get from their source of production to you (repeat the basic questions)
Breakfast travels • Scaling up • How many students ate breakfast this morning at MHC? • In South Hadley? • In Hampshire County? • In the Pioneer Valley? • In Massachusetts? • What’s involved in feeding breakfast to so many people?
Impacts of Breakfast Impact of breakfast = Population (demand for coffee & muffins) x Affluence (how many people can afford coffee & muffins) x Technology (environmental damage resulting from each cup of coffee & each muffin)
Our Ecological “Footprint” • In 1986, Vitousek et al. estimated that human activities “appropriated” 40% of terrestrial photosynthesis. In other words, 40% of all energy reaching the Earth’s land surface is used by human beings. (Source: Vitousek, P. M., P. R. Ehrlich, A. H. Ehrlich, & P. A. Matson. 1986. Human appropriations of the products of photosynthesis. BioScience 36: 368-373.).
Our Ecological “Footprint” • Human activities ‘appropriate’ 40% of terrestrial photosynthesis. • What about the other 10 million or so species that share Earth with Homo sapiens?
Ecological Footprints Defined • An ecological footprint accounts for flows of energy and matter to and from any defined economy and converts them into the corresponding land and water area required from nature to support these flows. (Source: Wakernagle, M. & W.Rees. 1990. Our ecological footprint: reducing human impact on the Earth. New Society Publishers, Gabriola Island, British Columbia, Canada).
Obtaining your Footprint • Ask yourself: “If you put your home town (or Mount Holyoke College, or your home) under a glass dome, how big would the dome have to be so that the town (or MHC, or your home) would be able to sustain itself completely and exclusively on the ecosystems within the dome?”
What’s your Footprint? • The average ecological footprint of a resident of North America is 5 hectares (50,000 square meters, or 12.4 acres, or 538,200 square feet)
What’s your Footprint? • The average ecological footprint of a resident of North America is 5 hectares (50,000 square meters, or 12.4 acres, or 538,200 square feet) • The approximate amount of “ecologically productive” land on the Earth is approximately 1.5 ha per person (1995 data).
What’s the Conclusion? • The average ecological footprint of a resident of North America is 5 hectares (50,000 square meters, or 12.4 acres, or 538,200 square feet) • The approximate amount of ‘ecologically productive’ land on the Earth is approximately 1.5 ha per person (1995 data). • If all 6+ billion people on the planet lived like an average third-millenial North American, we’d need at least 2 additional Earths to support them.
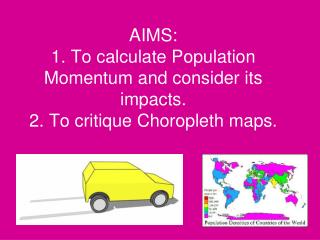
What are the Solutions? • If I = P A T, then • there are three ways to reduce environmental impacts: • Reduce population growth rate (and size) • Reduce affluence (live with less) • Reduce impacts of consumption (increase efficiency of production, and account for all costs)
How many people can the Earth support?* • What do you think? • Why is your estimate reasonable? • What have others estimated? • Where are we at now? • See the book of this title by Joel E. Cohen, published in 1995 by W. W. Norton & Co.
How many people can the Earth support? • What do you think?
How many people can the Earth support? • Before we start… • How many people are there now on Earth?
How many people can the Earth support? • What do you think?
How many people can the Earth support? • What do the “experts” think? • 54 168 billion
How many people can the Earth support? • What do the “experts” think?
How many people can the Earth support? • Where are we at now? • 6 billion, more or less.
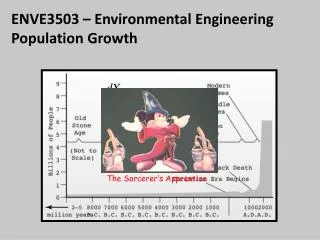
How many people can the Earth support? • Where are we at now? • 6 billion, more or less • How did we get here?
How many people can the Earth support? • Where are we at now? • 6 billion, more or less • How did we get here? • More recently…(since the last ice age)
How many people can the Earth support? • Where are we at now? • 6 billion, more or less • How did we get here? • More recently…(since the birth of Jesus)
How many people can the Earth support? • Where are we at now? • 6 billion, more or less • How did we get here? • More recently…(since the Plague)
How many people can the Earth support? • Where are we at now? • 6 billion, more or less • How did we get here? • More recently…(since the Industrial Revolution)
What are the factors that limit population size? Arable land Agriculture/industry/medicine Energy Food Water Photosynthesis Space Waste Atmosphere Disease How many people can the Earth support?
Slowing population growth • Briefly: • An oft-stated goal of individuals who would like to stabilize the rate of population growth is the achievement of Zero Population Growth (ZPG).
Slowing population growth • Briefly: • An oft-stated goal of individuals who would like to stabilize the rate of population growth is the achievement of Zero Population Growth (ZPG). • ZPG is usually defined as net replacement rate =1.0 per woman, equivalent to 2 children per couple.
Slowing population growth • Briefly: • An oft-stated goal of individuals who would like to stabilize the rate of population growth is the achievement of Zero Population Growth (ZPG). • ZPG is usually defined as net replacement rate =1.0 per woman, equivalent to 2 children per couple. • If ZPG happened tomorrow, how big would the world’s population be when it stopped growing?
Demographic inertia • The importance of age structure in determining population growth rate: all individuals are not the same
Demographic inertia • The importance of age structure in determining population growth rate: all individuals are not the same • Any individual can be placed into an age class, defined by (for example): • her age • her probability of survival • her reproductive potential
Demographic inertia • The pattern of survivorship, births and deaths determines: • the population growth rate, r • the net replacement rate R0 • the age structure • the “inertia” of population growth
Demographic inertia • If ZPG happened tomorrow… • the world’s population would stop growing when it reached 9.7 billion people (or, 2.8 billion people from now). • WHY?
Demographic inertia The key is the population age structure Click here if you want the gory mathematical details!
If you want to slow the rate of population growth: Decrease the birth rate have fewer children have them later Increase the death rate War Famine Pestilence Disease The take-home message You Decide
Alternatives... • If I = P A T, then • there are three ways to reduce environmental imapcts: • Reduce population growth rate (and size) • Reduce affluence (live with less) • Reduce impacts of consumption (increase efficiency of production, and account for all costs)