Download
1 / 33
330 likes | 338 Views
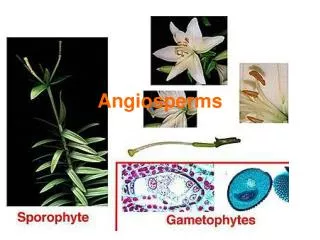
Presented by COAST coordinator W.Bonne at ECOSTAT 28 June 2011. Intercalibration Angiosperms Mediterranean. Teresa Alcoverro (coordinator). The methods. Metrics Employed.

E N D
Presented by COAST coordinator W.Bonne at ECOSTAT 28 June 2011 Intercalibration Angiosperms Mediterranean Teresa Alcoverro (coordinator)
Metrics Employed • PREI (5): shoot density, shoot leaf area, epiphyte biomass/leaf biomass, depth of the lower limit, type of the lower limit • POMI (14): shoot density, cover, percent plagiotrophic rhizomes, shoot surface, necrosis, nitrogen content rhizomes, sucrose content in the rhizomes, P rhizome, N content in epiphytes, Cu, Pb, Zn in rhizomes, N15 rhizomes, S34 in rhizomes • VALENCIA CS (9): shoot density, cover, dead matter, percent of plagiotrophic rhizomes, rhizomes burial/baring, shoot surface, necrosis, herbivore pressure, leaf epiphyte biomass
Integration Method • PREI: Average of the metrics • POMI: Principal Components Analysis • Valencian CS: Principal Components Analysis
COASTAL WATERS – Mediterranean Sea GIG – Seagrasses Greece submitted justification for Cymodocea method
Participating Member States (that have provided data/information) o Spain (All regions: only data from Catalonia and Valencia for Option 2) o France (all data for Option 2) o Croatia o Cyprus o Italy o Greece (no Posidonia data) o Malta (preliminary data 1st phase, not included in analysis) (common metric 1st phase not applicable) • Intercalibration between the methods PREI (FR), CS (ES – Valencia) and POMI (ES, Catalonia) • Benchmarking with the other countries using the same method
Intercalibration of the methods • The methods: PREI, POMI and CS • Relationship between methods and pressures • Option 2: using an intercalibration common metric • Type of pressure: subtraction: Option 2_substraction • Determination of the benchmarks
How reference conditions are established • PREI: Average of the best 3 values for each metric • POMI: Average of the best 3 values for each metric • Valencian CS: Average of the best 3 values for each metric
The pressures Anthropogenic pressures that have been observed to effect Posidonia oceanica ecosystems: eutrophication, organic matter and direct effects. All different integrated pressures will consider this factors.
Relationships with the pressures: CS Pressures
Common metric: ICM The intercalibration Common Metric: ICCM based in 2 metrics: • the lower limit type of the meadows and • leaf surface area per shoot integrated following the BiPo index (Lopez y Royo et al. 2008)
Determining a benchmark We have defined benchmark sites as sites presenting very low pressures following the next criteria: • -low population density: no settlement in the next 3 km (or less than 100 habitats/ha within that area) • -mooring density lower than 2 mooring ha-1 • -no harbour or mooring facility in 3 km • -no beach regeneration within 10 km • -no trawling in the area • -no industries within the 3 km • -no fish farms • -no desalination plants • -no evidence of meadow degradation due to other unconsidered impacts
Relationship between methods and ICM: PREI EQR PREI Results extracted from IC_Opt2_subSeagrass MED.xlsx
Relationship between methods and ICM: CS EQR CS Results extracted from IC_Opt2_subSeagrass MED.xlsx
Relationship between methods and ICM: POMI EQR POMI Results extracted from IC_Opt2_subSeagrass MED.xlsx
Intercalibration process-substraction • Class boundaries of each national classification system are translated onto the ICCM, using the file IC_Opt2_subSEAGRASS MED.XLSX
Intercalibration with the rest of the countries-same method • We have done and ANOVA between benchmarks of each regions within each method
Final points • We consider this intercalibration phase to be finished for Spain, France, Italy, Cyprus, Croatia • Some countries have to do the intercalibration or use an ongoing method (Malta). • Greece has presented a new method cymo-skew that needs to be accepted by the commission. Intercalibration need to be performed in the next phase.
Final requests • Cyprus is invited to explain how they have taken into account potential differences from an island perspective (how is this reflected in the reference) • Italy is invited to explain their opinion why the PREI is similarly applicable in their territory • Amount of benchmark values is low – but it is the only group who has applied a common boundary setting procedure • Ecological characterization of G/M boundary
WG Macroalgae – CW Presentation: S. Orfanidis Coordination of group: Xavier Torras, Luisa Mangialajo (with the support of Paola Gennaro)
COASTAL WATERS – Mediterranean Sea GIG – Macroalgae and seagrasses
Validation workshop WFD: Intercalibration: Internet meeting(22 June 2011) Two Methods: CARLIT, EEI-c IC option 2: The common dataset 133 taxa (a reduced species list) 62 Sites [40 CARLIT, 22 (186 replicates) EEI-c] + 2 ideal Sites (Reference, Degrated) SPAIN: 6 Benchmarks (median EQR 0.89), GREECE: 8 Benchmarks (median EQR 0.81)
Validation workshop WFD: Intercalibration: Internet meeting(22 June 2011) Two Methods: CARLIT, EEI-c IC option 2: PCO analysis, ICM ICM COMMA (Common macroalgae) (the 1st axis of a multivariate analysis)
Validation workshop WFD: Intercalibration: Internet meeting(22 June 2011) Two Methods: CARLIT, EEI-c IC option 2: ICM-Indices relationships
Validation workshop WFD: Intercalibration: Internet meeting(22 June 2011) Two Methods: CARLIT, EEI-c IC option 2H/G and G/M boundary EQR values
Validation workshop WFD: Intercalibration: Internet meeting(22 June 2011) Two Methods: CARLIT, EEI-c IC option 2: INTERCALBRATION FINAL RESULTS (excel sheet IC_Opt2_sub v 1.24; MS_A=SPAIN, MS_B=GREECE)
Validation workshop WFD: Intercalibration: Internet meeting(22 June 2011) Two Methods: CARLIT, EEI-c IC option 2: NOT ANY ADJUSTMENT IS NEEDED! Why, any explanation?? Analysis of variance between the different benchmarks for each method (CARLIT, EEI-c) at a bilateral (Spain, Greece) scale Average and standard deviation values for the different benchmarks at each country. -The Benchmark EQR values were assessed by CARLIT (0.915) were higher than those of EEI-c (0.836) across Mediterranean Sea. -This difference may due to different sampling strategies implemented: while the sampling of CARLIT method realized during the high growth period of Cystoseira species may estimate maximum EQR values of the benchmark sites, the sampling of EEI-c method realized during whole year may estimate average EQR values of the benchmark sites.
FR ES • Pressure relationships: adjustment of pressure index IT GR