Download
1 / 13
130 likes | 135 Views
Validation and interpretation of OMI tropospheric NO 2 observations during INTEX-B and comparison to SCIAMACHY. Folkert Boersma, D.J. Jacob, R.J. Park, R.C. Hudman – Harvard University H.J. Eskes, J.P. Veefkind, R.J. van der A, P.F. Levelt, E.J. Brinksma – KNMI

E N D
Validation and interpretation of OMI tropospheric NO2 observations during INTEX-B and comparison to SCIAMACHY Folkert Boersma, D.J. Jacob, R.J. Park, R.C. Hudman – Harvard University H.J. Eskes, J.P. Veefkind, R.J. van der A, P.F. Levelt, E.J. Brinksma – KNMI A. Perring, R. Cohen, T. Bertram, P. Wooldridge – University of California E.J. Bucsela, J.F. Gleason – NASA GSFC A. Gilliland – NOAA/EPA
Spiral 1 (down) Spiral 2 (up) Important goal INTEX-B: EOS-Aura Validation • Integration of aircraft and satellite observations • Sub-satellite spirals (0-12 km) for validation OMI trace gases Criteria Cloud fraction < 20% Use all OMI pixels covered by spatial extent of spiral Use of KNMI analysed near-real time product (www.temis.nl)
DC8: 1.90 1015 molec. cm-2 OMI: 2.62 ± 1.68 1015 molec. cm-2 (n = 19) Berkeley TD/LIF Validation of OMI tropospheric NO2: 4 March 2006
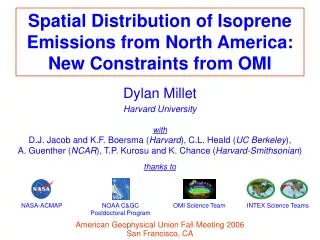
Mexico City Remote Gulf of Mexico All OMI validation spirals during March 2006 All spirals r = 0.89 n = 18 DC8-OMI: +0.31 1015 molec. cm-2 RMS: 1.18 1015 molec. cm-2
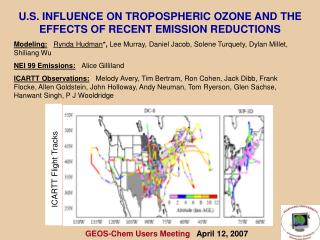
OMI vs. GEOS-Chem NO2 with EPA NEI99 emissions • GEOS-Chem with • NEI99 • too high (+30%) over midwest • too low over Mexico (up to -50%) OMI GEOS-Chem NEI99/BRAVO
Mobile Other Industry Power plants EPA emission reports Studies by Richter et al. (2005) and van der A et al. (2006) also show negative trend in NO2 columns OMI ~60% ~20%
Frost et al.: -20% (1999-2004) r2=0.86 r2=0.87 Have emissions changed since 1999? • Decompose OMI derived NOx emissions with SVD • Decompose best guess of inferred emissions into underlying basis functions • Basis functions: EPA (1999) source category patterns Total NOx emissions: -2.5% (March 1999 – March 2006) Power plants: -22% 15% Mobile: +31% 16% Other industry: +9% 29% Rest: -45% 45%
How do SCIAMACHY and OMI compare? • Method • Grid SCIAMACHY and OMI NO2 observations on 0.5 x 0.5 grid • Take only those grid cells that were cloud-free for both instruments • Compute monthly averages SCIAMACHY: 10.00 hrs local time OMI: 13.30 hrs local time
r = 0.76 n = 1.9×10⁶ OMI 10-40% lower than SCIAMACHY for most anthropogenic source regions OMI higher than SCIAMACHY for biomass burning regions
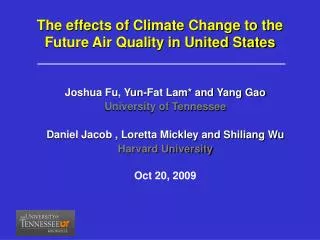
Simulating 10am to 1:30pm with GEOS-Chem Relative decrease in NO2 column from 10am to 1:30 pm Observed GEOS-Chem US: -16% -28% EU: -6% -13% China: -26% -22%
2003 2005 Biomass burning mainly in afternoon 2001 2002 2004 Relative increase in NO2 column from 10am to 1:30 pm Jun Wang Observed GEOS-Chem Africa: +48% +16% Indon.: +60% +10% Brazil: +54% +13%
Conclusions Conclusions • OMI NO2 validation during INTEX-B: r=0.89, low bias -0.3 1015 • Decreasing power plant NOx emissions (-20%, 1999-2006) • Evidence for increasing mobile emissions (+30%, 1999-2006) • 3. SCIAMACHY and OMI observe • - photochemistry • - diurnal emission patterns from space