Download
1 / 26
260 likes | 359 Views
Engineering Assessment of Hydrogen Sulfide Issues. Emission Inventory State Survey of Ambient Air Standards Regulatory Practice in Other States H 2 S from Hog Farms Dispersion Modeling Study H 2 S Stability Proposed Control Technologies. Emission Inventory.

E N D
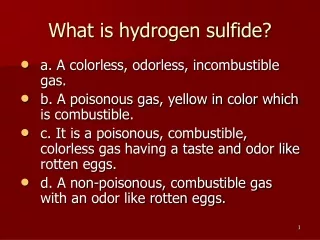
Engineering Assessment of Hydrogen Sulfide Issues • Emission Inventory • State Survey of Ambient Air Standards • Regulatory Practice in Other States • H2S from Hog Farms • Dispersion Modeling Study • H2S Stability • Proposed Control Technologies
Emission Inventory • Initial records based on 1999 NC-DAQ Inventory • Revised in 2002 to include paper mill wastewater treatment, 89% of paper industry emissions • Soft WWT estimates; high variability data base • Fertilizer and paper are most emissive industries • Hog farms excluded due to poor data quality - Data overstates NC hog emissions by more than 10-fold
Figure 1. 1999 Emissions Inventory Total = 4.2 Million lb H2S/yr
Figure 2. Revised 2002 Inventory Total = 11.9 Million lb H2S/yr
Table 1. H2S Emissions Inventories (a) (a) (a) = Potential emissions, max hour repeated all year.
State Survey of Ambient Air Standards • No federal ambient air standards • 35 states set their own standards - 13 with 1-hr from 14-280 ug/m3 (10 – 200 ppb) - 13 with 24-hr from 8.4-280 ug/m3 (0.6 – 200 ppb) - 26 other standards - Several states have more than 1 standard
H2S Regulatory Practice in Other States • Contacted 4 similar states - South Carolina - Georgia - Minnesota - Wisconsin
South Carolina H2S Program • Effective in 1991; 100 ppb 24-hr standard • Compliance by modeling or monitoring • Existing facilities 2 yrs to demonstrate • Modeled parameters included in permit • MACT compliant facilities are exempt • 3 of 7 paper mills modeled for H2S - Only 1 included WWTS: 1.6 Million lb/yr
Georgia H2S Program • Guidelines for assessment • Facility derives acceptable ambient level • Use EPA, OSHA, ACGIH or NIOSH limits • Model with 5 yrs met data to determine maximum ground level concentration • If max concentration more than AAL, then reduce max concentration responsibly • All subject to agency review & approval
Minnesota H2S Program • Effective in 1969; - 30 ppb 30-min standard - 50 ppb 30-min std w/2 exceedances/yr • In ~1988 paper mills exceeded H2S standard - Installed activated sludge units initially - Then added covers and oxygenation • Mills meet 30 and 50 ppb standards
Minnesota H2S Program (con’d) • Recently found hog farm H2S problem • Trend of fewer, but larger farms • State colleges do much research • State agency responds to odor complaints - Uses ambient monitors to measure - Encourages voluntary compliance - Serves as source of helpful information
Wisconsin H2S Program • Effective in 1988; 240 ppb 24-hr std • Structured similar to NC toxics - Conservative screening emission rates - Model if more than screening emission rates • No req’ts for paper mill WWTS • Considering hog lagoon solutions
H2S from NC Hog Farms • NC focused on ammonia and nitrogen issues - No official NC hog farm H2S emission data • Draft EPA emission data based only on midwest farms from unpublished test - National Academy of Science criticizes EPA data as incomplete and too general - Midwest farms have dissimilar design, operations, climate and bacteria from NC farms that directly affect emissions and odors - Likely overstate NC hog H2S by more than 10-fold
DAQ Dispersion Modeling Study • Modeled phosphate fertilizer and paper mill plants • Assess impact area & health benefits relative to 33 ug/m3 24-hr & 56 ug/m3 24-hr proposed AALs • Determined impact radius, i.e., distance from plant where levels more than proposed AALs • Determined avg number of exceedances, i.e., typical locations within impact radius with levels more than proposed AALs
H2S Stability in Ambient Air • Generally stable 18 hrs – 3 days • Extreme conditions 2 hrs – 42 days • H2S not photochemically reactive • Changes to sulfur dioxide or sulfuric acid
Proposed Control Technologies- Paper industry • Activated sludge – biological process without chemicals to reduce H2S • Add covers, collect and incinerate off gas • Decommission settling and aeration ponds • Blue Ridge Paper has activated sludge • Few activated sludge units at mills
Figure 7. Aerial Photograph International Paper Roanoke Rapids
Proposed Control Technologies- Fertilizer industry • Currently no controls • Install packed bed scrubber on phosphoric acid plant point sources • Use special solution to absorb H2S • 99 + % required to marginally meet 33 ug/m3 and 56 ug/m3 AALs • New technology for this industry