Download
1 / 18
180 likes | 305 Views
Demonstration of the gravitational acceleration value. Methods used to calculate “g”. Wireless dynamic sensor system (WDSS); Position sensor; Curve fitting. WDSS.

E N D
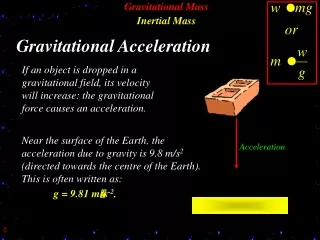
Methods used to calculate “g” • Wireless dynamic sensor system (WDSS); • Position sensor; • Curve fitting.
The Wireless Dynamcs Sensor System allows you to take data from a three-axis accelerometer, a force sensor, and an altimeter, using a Bluetooth wireless connections to your computer. It is the perfect tool for dozens of physics and physical sciences experiments. We used it to measure the gravitational acceleration.
WDSS specifications: • Dimensions: 12.1 cm x 5.3 cm x 3.9 cm • Mass: about 200 g depending on battery type used and attachments Accelerometers • Range: -60 to +60 m/s2 • Accuracy: +/- 0.5 m/s2 (+/- 0.05 g)
Experiment description The experiment consists in dropping the WDSS from about 2.20 meters in a box to reduce the impact. The WDSS measures automatically the acceleration. Then we connect it to the computer which process the data.
Position sensor The position sensor uses ultrasound to study the body motion. It reports only the position of the nearest object which produces the most intense echo.
Technical characteristics • - Ultrasound frequency: 40 KHz • - Resolution: 1 mm • - Accurency: ± 2 mm • Range: 0.15 m / 6 m
Curve fitting We dropped a ball from a given height and we filmed it. Then we used a software (Logger Pro) which draws the position of the ball on a graph frame by frame and processes speed, time and position related to the given height.
Using the curve fitting, the process of constructing a curve, or mathematical function, that has the best fit to a series of data points, we calculated the best approximation of the gravitational acceleration.
Conclusions To sum up: In all three methods the results are approximately similar to the standard value of “g” (9,81m/s2). The errors in the last experiments are due to the material of the ball (sponge) because of the friction with the air.