Download
1 / 2
20 likes | 94 Views
At5g63790 ANAC102. At2g04040 MATE efflux. KO-1. OX-1. Col-0. C24. 68.5. 10.5. 58.5. 8.5. 48.5. 6.5. 38.5. 4.5. Relative expression. Relative expression. 28.5. 2.5. 18.5. 0.5. 8.5. -1.5. -1.5. 0. 5. 10. 15. 20. 25. 0. 5. 10. 15. 20. 25. time (hours).

E N D
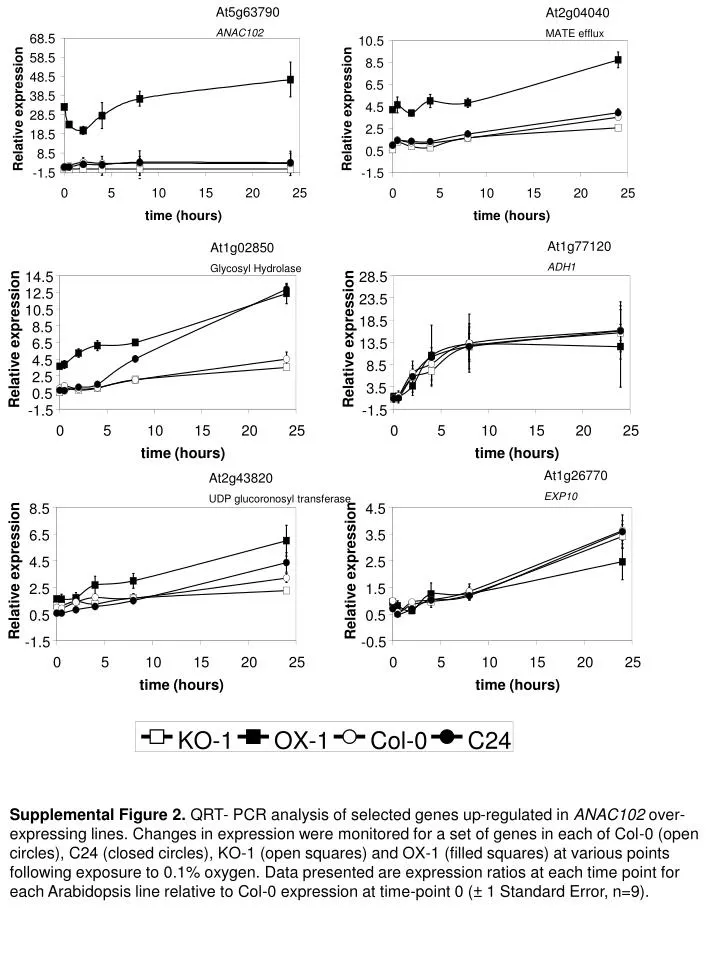
At5g63790 ANAC102 At2g04040 MATE efflux KO-1 OX-1 Col-0 C24 68.5 10.5 58.5 8.5 48.5 6.5 38.5 4.5 Relative expression Relative expression 28.5 2.5 18.5 0.5 8.5 -1.5 -1.5 0 5 10 15 20 25 0 5 10 15 20 25 time (hours) time (hours) At1g77120 ADH1 At1g02850 Glycosyl Hydrolase 14.5 28.5 12.5 23.5 10.5 18.5 8.5 Relative expression Relative expression 6.5 13.5 4.5 8.5 2.5 3.5 0.5 -1.5 -1.5 0 5 10 15 20 25 0 5 10 15 20 25 time (hours) time (hours) At1g26770 EXP10 At2g43820 UDP glucoronosyl transferase 8.5 4.5 6.5 3.5 4.5 2.5 Relative expression Relative expression 2.5 1.5 0.5 0.5 -1.5 -0.5 0 5 10 15 20 25 0 5 10 15 20 25 time (hours) time (hours) Supplemental Figure 2. QRT- PCR analysis of selected genes up-regulated in ANAC102 over-expressing lines. Changes in expression were monitored for a set of genes in each of Col-0 (open circles), C24 (closed circles), KO-1 (open squares) and OX-1 (filled squares) at various points following exposure to 0.1% oxygen. Data presented are expression ratios at each time point for each Arabidopsis line relative to Col-0 expression at time-point 0 (± 1 Standard Error, n=9).
At5g43580 Protease inhibitor At3g59140 ABC transporter 10.5 12.5 10.5 8.5 8.5 6.5 6.5 Relative expression Relative expression 4.5 4.5 2.5 2.5 0.5 0.5 -1.5 -1.5 0 5 10 15 20 25 0 5 10 15 20 25 time (hours) time (hours) At1g72680 CAD At2g30140 UDP glucoronosyl transferase 10.5 5.5 8.5 4.5 6.5 3.5 Relative expression Relative expression 4.5 2.5 2.5 1.5 0.5 -1.5 0.5 0 5 10 15 20 25 0 5 10 15 20 25 time (hours) time (hours) At1g68570 POT At3g56710 Sig 1A binding protein 2.5 18.5 2 13.5 1.5 Relative expression Relative expression 8.5 1 3.5 0.5 0 -1.5 0 5 10 15 20 25 0 5 10 15 20 25 time (hours) time (hours) KO-1 OX-1 Col-0 C24 Supplemental Figure 2. QRT- PCR analysis of selected genes up-regulated in ANAC102 over-expressing lines. Changes in expression were monitored for a set of genes in each of Col-0 (open circles), C24 (closed circles), KO-1 (open squares) and OX-1 (filled squares) at various points following exposure to 0.1% oxygen. Data presented are expression ratios at each time point for each Arabidopsis line relative to Col-0 expression at time-point 0 (± 1 Standard Error, n=9).