Download
1 / 26
270 likes | 452 Views
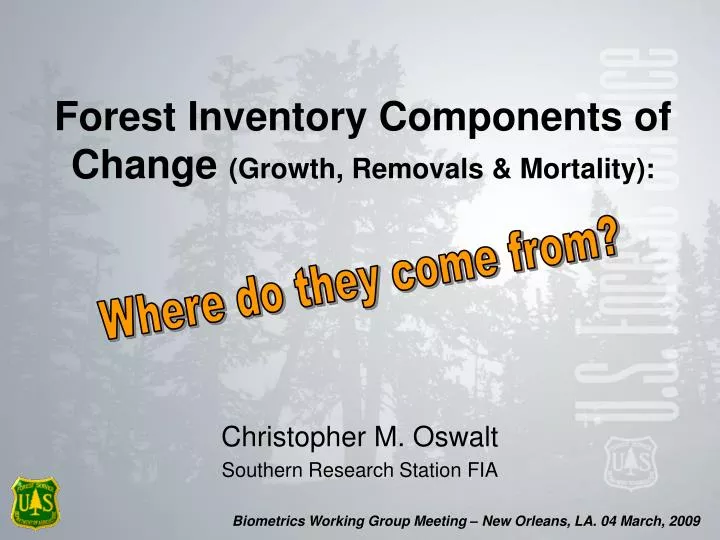
Forest Inventory Components of Change (Growth, Removals & Mortality):. Where do they come from?. Christopher M. Oswalt Southern Research Station FIA. Outline. Brief introduction of the topic Walk through the components of change Examples Recent regional trends Challenges Summary.

E N D
Forest Inventory Components of Change (Growth, Removals & Mortality): Where do they come from? Christopher M. Oswalt Southern Research Station FIA Biometrics Working Group Meeting – New Orleans, LA. 04 March, 2009
Outline • Brief introduction of the topic • Walk through the components of change • Examples • Recent regional trends • Challenges • Summary
Introduction • Development informs utilization • Of interest: • A population as recruitment occurs into, through, and eventually exiting some expressed standard
Conceptually Simple Inventory Then G M G G G G G G R R R G G G G G G M M R Inventory Now
Survivor growth Ingrowth Mortality Cut Reversions Diversions Cull increment (minus) Cull decrement Growth on ingrowth Mortality growth Cut growth Reversion growth Diversion growth Cull increment growth Cull decrement growth Components of Change
T1 T2 Assumptions • Time of change is between then and now, but exactly when is unknown • Time of change is estimated to be midway between t (time 1) and t+1 (time 2) • Growth model is used to predict midpoint tree size • Usually based on past attributes • Based on current attributes when there are no past attributes
Components of GRM • Survivor growth • Trees alive and measured time 1 and time 2 • Diameter >= threshold (e.g. 5.0”) both times • No change in tree class (growing stock, cull, etc.) • Contributes to G Threshold DBH
Components of GRM • Ingrowth • Tree below threshold time 1 (may or may not have been measured) • Tree grows across threshold before time 2 • Contributes to G Threshold DBH
Components of GRM • Mortality • Tree alive time 1 • Tree dead time 2 • Predicted midpoint diameter used to compute volume • Contributes to M
Components of GRM • Cut • Tree alive time 1 • Tree cut before time 2 • Predicted midpoint diameter used to compute volume • Contributes to R
Components of GRM • Cull increment • Growing stock time 1 • Cull time 2 • Predicted midpoint diameter used to compute volume • Reduces G
Components of GRM • Cull decrement • Cull time 1 • Growing stock time 2 • Predicted midpoint diameter used to compute volume • Contributes to G
Components of GRM • Reversion • Nonforest (or non-timberland) time 1 • Forest (or timberland) time 2 • Predicted midpoint diameter used to compute volume • Contributes to G
Components of GRM • Diversion • Forest (or timberland) time 1 • Nonforest (or non-timberland) time 2 • Predicted midpoint diameter used to compute volume • Contributes to R
GRM’s Defined (Scott et. al 2005) • Growth • Gross ingrowth = Ingrowth + Reversion • Gross growth = Gross ingrowth + accretion • Accretion = GS+GI+GR+GM+GC+GD • Net growth = Gross growth - mortality • Removals • Cut stems and/or Diversions (forest – nonforest or timberland-reserved) • Mortality • Death from natural causes
Growth & Removal Trends Growing Stock on Timberland Solid line - Growth Broken line - Removals
Growth & Removal Trends Growing Stock on Timberland
Challenges • Historical reporting biases and naming conventions • Not all FIA reported removals reflect “removed” trees • Change and growth not the same thing • Address through – additional tables or definitional changes? • Historic variability in interpreting reserve status • GRM estimates are highly sensitive to changes in reserve status • Address from what angle - data acquisition or compilation/processing? • Not applicable on forest land • Regional inconsistencies • Current estimation procedures • Mapped plot to mapped plot implementation
Additional Detail Total AAR – AAR(diversions) = More informative picture of actual removals
Challenges • Historical reporting biases • Not all FIA reported removals reflect “removed” trees • Address through – additional tables or definitional changes? • Historic variability in interpreting reserve status • GRM estimates are highly sensitive to changes in reserve status • Address from what angle - data acquisition or compilation/processing? • Not applicable on forest land • Regional inconsistencies • Current estimation procedures • Mapped plot to mapped plot implementation
Currently… Not all there yet. South Primarily annual to annual North Primarily annual to annual Rocky Mountain Remeasurement has not started Pacific Northwest Testing in California National Forests Similar plot footprints (periodic to annual) in Alaska (testing)
Challenges • GRM labeling conventions to facilitate proper interpretation • FIDO II • Tennessee: 2007 GRM - Tennessee (47) -- Mortality :: growing-stock on timberland by U.S. Counties and Major species group (in cuft/year) 2000 2002 2001 2003 2005 2006 2008 2009 2004 2007
Challenges • Lack of access to previous condition when using external data tools • Internal – uses previous condition (correct) • External – uses current condition (wrong) Example – TN(2007) – Removals of live trees on forest land by stand size class Million ft3 year-1
Summary • GRM is conceptually simple • GRM analysis is complicated by the fact that the same tree can contribute to different components of GRM • GRM analysis will become simpler and more precise in the future • Additional analytical techniques needed • Refinements in methodology potentially necessary • Updates to some external tools needed
Acknowledgements • Ray Sheffield • Gary Brand • Bill Burkman • John Coulston