Download
1 / 57
570 likes | 574 Views
This paper discusses the potential of nuclear power in reducing CO2 emissions, including the history, results from modeling approaches, and future directions. It also addresses challenges related to uranium resources, waste disposal, and advanced fuel cycles.

E N D
What Nuclear Power Can Accomplish to Reduce CO2 Emissions Robert A. Krakowski(a) and Richard Wilson(b) 2002 ASME International Mechanical Engineering Congress November 17-22, 2002 New Orleans (a) Systems Engineering and Integration Group, Los Alamos National Laboratory (b) Department of Physics, Harvard University
What Nuclear Power Can Accomplish to Reduce CO2 Emissions Outline • Background - State of the Planet (Top Concerns, Global-Warming Trends) ; - Global Economic-Energy-Environmental (E3) Modeling Approaches (“Top-Down” versus “Bottom-Up”); - Energy Demand and Greenhouse Gas (mainly CO2) Emissions, along with other Socioeconomic, Technological, and Political Drivers; • Nuclear Energy History (growth, avoided CO2, cost, sustainability issues); • Sample Results from a “Top-Down” E3 Model - Base Case Illustrating Magnitudes/Tradeoffs of NE versus CO2 Mitigation; - Scenario Analysis and NE Requirements to Reduce CO2 Emissions; • Conclusions/Future Directions
State of the Planet: Seven Setbacks(a): Nuclear Energy is On Both the Giving and Receiving Ends of the Problem • Global Warming: November 2001 – January 2002 in US warmest since records were taken (1895); • An Appetite for Oil: Consumption grew 14% in 1990s, accounts for 40% of CO2 emissions: • Disappearing Wetlands: 31 years after Convention on Wetland (132 Nations), results are disappointing; 50% destroyed 1900s; • Rise of Megadams; 5,000 45,000 large dams (larger than 17 m high) in the world over the 1950 – 2000 period; • Coral Reefs: 27% lost in last 50 years, 16% during 1998 El Nino; • Overfishing: Marine “principle” is being spent; cod, bluefin tuna, grouper populations are plummeting; • Nuclear Waste: This year 400 NPPs create more than 11,000 tonne of spent nuclear fuel (SNF, labeled as “waste”); pose problems of accidental leakage and terrorist attack (161 million people within 100 km of SNF storage). (a) National Geographic, p. 108 (September, 2002).
1000 1200 1400 1600 1800 2000 1000 1200 1400 1600 1800 2000 Year Year The Increase in Global Temperature During the 20th Century is Likely the Largest of Any Century for the Last 1000 Years and Correlates with Increased Atmospheric CO2 Concentrations Reconstruction of Average Temperatures in the Northern Hemisphere Growth in Atmospheric Carbon Dioxide Concentration
What Nuclear Power Can Accomplish to Reduce CO2 Emissions and What is Needed • Reductions of CO2 emission rates to present values ( ~6 GtonneC/yr) by 2100 will require 5-7,000 GWe, or 15-20 times present world capacity; deeper reductions are possible for non-electric applications of nuclear energy (H2 production from water splitting). • Uranium-resource and waste-disposal implications of supplying this capacity over the next 100 years based on once-through fuel cycle are significant: 4-5 times present world (conventional + known + estimated) uranium resources (16 MtonneU at 160 $/kgU); one Yucca Mountain (globally) every few (or less) years; a total of ~50,000 tonne reactor-grade plutonium contained in the spent fuel so disposed by the year 2100. • Advanced, plutonium-burning/recycling fuel cycles will be needed to reduce (significantly) both the fuel-resource and the waste disposal (mass, volume, long-term radio-toxicity) requirements; reduction by factors of 40-50 attend this comparable increase in energy-resource utilization. • The economics of achieving this predominant nuclear role are within reach for known (once-through) technologies; advanced (high recycle/burn-up) fuel cycles may add 10-20% to the life-cycle cost; these costs should be competitive with any “closed” fossil fuel cycle used to generate electricity. • Deployment rates (80-90 GWe/yr) for once-through reactors have been approached in the past; extensions to the required advanced reactor technologies require demonstration.
What Nuclear Power Can Accomplish to Reduce CO2 Emissions and What is Needed (cont.-1) • Proliferation propensities should be very low for advanced fuel cycles that minimize total plutonium inventories while assuring strong intrinsic and extrinsic barriers to clandestine use through theft or diversion; detailed designs and management systems must be implemented to assure the reality of this claim. • Safe reactor operations at both public and operational levels have been demonstrated, but continuance of this experience must be assured, as well as extension thereof to other parts of the fuel cycle, particularly for high burn-up/recycle processes (reprocessing, storage, transport). • Socioeconomic, technological, and political drivers dictate the role played by nuclear energy in mitigating global warming, even with solutions in hand to the four cardinal issues of waste, proliferation, cost, and safety; more remains to be done in quantifying these drivers and interactions among them (population growth, productivity, economic equity, technology evolution and diffusion, degree of globilzation, personal freedoms versus added institutional controls, etc.).
Vein Deposits, Pegmatites, Unconformity Deposits Evaporates. Siliceous Ooze, Chert Black Shales Average Crust Granites Oceanic Igneous Crust Shales, Phosphates Ocean Water Volcanic Deposits Fossil Placers, Sandstones Fresh Water Vein Deposits Uranium Resource and Availability: Fuel Supply is Perceived as a Longer-Term Issue(a) • Redbook (OECD/IAEA) lists estimates by suppliers; • Limited recent incentives for exploration; • (Much) more ore is likely to found if price increases; • Fuel cycle contributes to < 20% of production costs. Waste management and not uranium resource is main issue for early (new) deployment. (a) D. Wade, “Goals for Future Nuclear Energy Systems and Fuel Cycle Concepts Proposed for the Generation IV Roadmap.” Symp. On Energy and Environment (October 2-4, 2002)
Waste Arisings Resource Base HLW + MA+ Pu Full Act.* Recycle HLW + MA Full Pu Recycle Partial Pu Recycle Spent Nuclear Fuel (SNF) Once- Thru “Top-Level” View of Nuclear Fuel Cycle Options That Diminish Both Waste and Resource Requirements U/Pu Electricity Conversion Spent Nuclear Fuel (SNF) * Act. = Pu + MA; SNF = Act.+ U + FP + SP
Schematic Diagram of Key Material Flows for a Range of Transmutation Scenarios(a) (a)R. A. Krakowski and C. G. Bathke, “Method for Quantitative Assessment of Cost and Proliferation Risks Associated with the Civilian Nuclear Fuel Cycle,” Los Alamos National Laboratory document LA-UR-02-2369 (April 26, 2002).
Sustainability Viewed As a “Three-Legged Stool” and Connected to the Four Canonical Issues Characterizing the Nuclear Fuel Cycle (NFC)
Overview of Systems Modeling Approaches for Quantifying Economy (LCC), Ecology (Waste), and Society (Proliferation)
“Top-Down” (Econometric) versus “Bottom-Up” (Technological) Modeling Methodologies(a) (a)Mapping the Energy Future: Energy Modeling and Climate Change, OECD/IEA report (1998)
Energy Drives Human Welfare, Fossil Fuel Drives Energy Consumption (90%), and Growing Atmospheric CO2 Concentration is Driven by Fossil Fuel Consumption • Present 6B world population is growing, 2B have no access to electricity, and access is marginal for another 2B people. • The developed countries comprise 25% of the world population, but consume 70% of the primary energy. • Fossil sources provide 90% of all energy fuels, and CO2 emissions (presently 6 GtonneC/yr) is growing with the growing use of fossil fuels. • Carbon emissions are related by the simple identity: RC(kgC/yr) = N*(GDP/N)*(PE/GDP)*(C/PE) N = population(persons); GDP =productivity ($/yr); PE = annual primary energy consumption (J/yr); C = carbon emission (kgC)
A Simple Identity Indicates Means to Reduce Global CO2 Emissions:RC(kgC/yr) = N*(GDP/N)*(PE/GDP)*(C/PE)
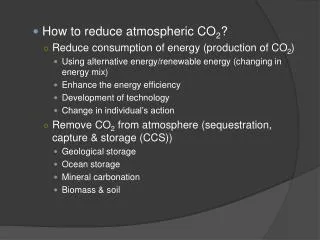
Top-Level Controls on CO2 Emissions vis-à-visRC(kgC/yr) = N*(GDP/N)*(PE/GDP)*(C/PE) • Population growth, N: a positive driver, presently stabilizing, not much control. • per-capita productivity, GDP/N ($/capita): a positive driver as HDI is increased for the world majorities, requires increased energy consumption. • Energy Intensity, PE/GDP (MJ/$): historic decreases reflect success in increasing economic productivity with less energy use. • Carbon Intensity, C/PE(kgC/GJ): Infers the development of energy electricity and portable-fuel sources with considerably reduced carbon emissions: - Renewable energy (solar PV, solar H2, wind); - Nuclear (fission, ultimately thermonuclear fusion).
The Key Drivers of GHG Emissions Are Highly Aggregated Results of Complex Socio-economic, Technological, and Political Drivers a) (a)K. Riahi and R. A. Roehrl, “Energy Technology for Carbon Dioxide Mitigation and Sustainable Development,” Environmental Economic and Policy Studies, 3, 89-123 (2000).
The Key Drivers of GHG Emissions Are Highly Aggregated Results of Complex Socio-economic, Technological, and Political Drivers (cont.-1)(a) (a)K. Riahi and R. A. Roehrl, “Energy Technology for Carbon Dioxide Mitigation and Sustainable Development,” Environmental Economic and Policy Studies, 3, 89-123 (2000).
The Key Drivers of GHG Emissions Are Highly Aggregated Results of Complex Socio-economic, Technological, and Political Drivers that Lead to Varying Levels of Sustainable or Non-Sustainable Futures(a) (a)K. Riahi and R. A. Roehrl, “Energy Technology for Carbon Dioxide Mitigation and Sustainable Development,” Environmental Economic and Policy Studies, 3, 89-123 (2000).
Energy-Related CO2 Emissions versus Time and Sector in IEA Countries(a) (a) IEA (1998), “Mapping the Energy Future: Energy Modelling and Climate Change Policy”, IEA Energy and Environment Policy Analysis Series.
Full-Energy-Chain Specific Carbon-Equivalent Emissions versus Generation Technology Kind and State(a) (a) J. V. Spadaro, L. Langlois, and B. Hamilton, “Greenhouse Gas Emissions of Electricity Generation Chains: Assessing the Difference, IAEA Bulletin, 42/2/2000, Vienna, Austria (2000)
By the End of Year 2000 Nuclear Energy Makes an Important Contribution to the World Electric Generation and CO2-Equivalent Emissions Mitigation(a) • Total capacity : 361 GWe; • Number of nuclear power plants: 438; • Multinational: 31 countries (85% OECD Members); • Production in 2000: 2,450 TWeh; • Contribution: 16% electric energy (EE) production, 6% of global commercial primary energy (PE); • Specific carbon-equivalent emission (kgC/MWeh): - Nuclear energy chain: 2.5-5.7 (-8% PE sector, -17% EE sector); - Renewable energy chain (solar PV, wind, hydro, bio) 2.5-76; - Fossil energy chain (gas, oil, coal, lignite): 105-366. (a)OECD/NEA, “Nuclear Energy and the Kyoto Protocol,” (2002)
World-wide History of Nuclear Energy Growth in Capacity(a) (a)Signposts 2002: Envisioning the Future,” WorldWatch Institute, Washington DC (2002)
Both Nuclear Electric and Hydroelectric are Important Contributors to Annual Reductions in CO2 Emissions(a) (a)OECD/NEA, “Nuclear Energy and the Kyoto Protocol,” (2002)
US Electricity Capacity versus Generation: Gas is Growing; Coal May Be Emission Constrained, Oil is Decreasing; Nuclear is Uncertain, but Performing Well
US Nuclear Electricity Generation, Capacity, and Capacity Factor versus Time Over Last Quarter Century
Operations and Maintenance Costs and Production Costs for US NPP Over the Past Two Decades(a) (a) N. J. Diaz, “Nuclear Technology: Global Accomplishments and Opportunities,” Nuclear News, 36 (May, 1998)
Effect of Carbon Tax on Levelized Generation Cost for Key Primary Fuels in Different Countries(a) (a)OECD/NEA, “Nuclear Energy and the Kyoto Protocol,” (2002)
Sustainability Viewed As a “Three-Legged Stool” and Connected to the Four Canonical Issues Characterizing the Nuclear Fuel Cycle (NFC)
Structural Layout of “Top-Down” (Econometrics) ERB Global E3 Model(a) (a)BARON, R, M., D. Barns, H. M. Pitcher, J. A. Edmonds, M. A. Wise, (1992) “The Second Generation Model of Greenhouse Gas Emissions: Background and Initital Development,” Coping with the Energy Future: Market and Regulations, 2, 15th Annual Converence of the International Associations for Energy Economics on Coping with the Energy Future: Market and Regulations (18-20 May 1992).
Key Model Drivers Used for ERB “Top-Down” E3 as Aggregated from 13 Regions to OECD, REF, and ROW Population per-capita GDP GDP
Time Evolution of Cumulative Demand for Six Primary Energy for BAU/BO Scenario(a,b) (a) R. A. Krakowski and R. Wilson, Chapter 7, R. G. Watts(ed.), Innovative Energy Strategies for CO2 Stabilization, Cambridge University Press, Cambridge UK (2002). (b) IAEA, Nuclear Fuel Cycle and Reactor Strategies: Adjusting to New Realities, (1997).
Comparison of World Nuclear Energy Generation Scenarios(a,b,c) (a) R. A. Krakowski and R. Wilson, Chapter 7, R. G. Watts(ed.), Innovative Energy Strategies for CO2 Stabilization, Cambridge University Press, Cambridge UK (2002). (b) OECD/NEA, “Nuclear Power and Climate Change, (April 1998). (c) IAEA, Nuclear Fuel Cycle and Reactor Strategies: Adjusting to New Realities, (1997).
Evolution of World CO2 Emission Rate, Integrated Emission, Atmospheric Accumulations, and Average Global Temperature Increase for BAU/BO Scenario
Impact of Phased Change in Unit Capital Cost of Nuclear on Demand and CO2 Emissions
Absolute Values of Key Parameters Total global plutonium, MPu(ktonne) 15.3 CO2 linear tax rate, CTAX($/tonneC/15yr) NE fraction of final energy, fNE 0.19 EE fraction of primary energy, fEE 0.15 Proliferation Risk Index, PRI 0.14 Atmospheric CO2, W(GtonneC) 1632. Average global temperature rise, DT(K) 2.6 CO2 emission rate, RCO2(GtonneC/yr) 19.8 Summary of Relative Sensitivities of Key Metrics in Year 2095 to Changes in Unit Total Capital Cost of Nuclear Generation
Impact of (Linearly) Increasing Carbon Taxes (Imposed After 2005) on Nuclear Energy Demand and CO2 Emission Rate
Absolute Values of Key Parameters Total global plutonium, MPu(ktonne) 15.3 CO2 linear tax rate, CTAX($/tonneC/15yr) NE fraction of final energy, fNE 0.19 EE fraction of primary energy, fEE 0.15 Proliferation Risk Index, PRI 0.14 Atmospheric CO2, W(GtonneC) 1632. Average global temperature rise, DT(K) 2.6 CO2 emission rate, RCO2(GtonneC/yr) 19.8 Summary of Relative Sensitivities of Key Metrics in Year 2095 to Imposition of (Linear) CO2 Taxes
SCENARIO ATTRIBU TES BAU ED Demand Scenarios (IIASA/WEC B) (IIASA/WEC C) Nuclear Scenarios BO PO BO PO Demand - Supply ED - PO ED - BO BAU - BO BAU - PO Scenarios Notes : Demand Scenarios: BAU=Business - As - Usual; ED = Ecologically Driven Nuclear Scenarios: BO=Basic Option; PO = Phase - out IIASA/WEC B: Scenario B in the IIASA/WEC Study IIASA/WEC C: Scenario C in the IIASA/WEC Study Nuclear-Energy Scenario Analyses(a) NO CTAX CTAX High UTC High UTC (a) “Scenarios of Nuclear Power Growth in the 21st Century, Report of an Expert Group Study (IAEA, Univ. Dauphine Paris, Los Alamos National Laboratory, Univ. Tokyo, and Energy Systems Institute of Russian Academy of Sciences, published by the Centre of Geopolitics of Energy and Raw Materials, University of Paris IX Dauphine (2002).
Scenario Analysis: Primary Energy Demand BAU-BO BAU-PO ED-BO ED-PO
Scenario Analysis: Global Primary, Secondary, Final and Energy Demands BAU-BO BAU-PO ED-BO ED-PO
GTOE/yr 25 BAU-PO 20 BAU-BO 15 ED-PO 10 ED-BO 5 Year Scenario Analysis: Global Fossil Fuel Consumption
MtonneC/yr BAU-PO BAU-BO ED-PO ED-BO Scenario Analysis: Global CO2 Emissions
Percent GDP ED-BO BAU-BO Year $/GJ ED-PO BAU-PO, ED-BO BAU-BO Year Scenario Analysis: Global Primary Energy Cost ED-PO BAU-PO
Scenario Analysis: Global Nuclear-Energy (Electricity) Demand TWeh/yr ED-BO BAU-BO GWe ED-BO BAU-BO
Conclusions: Role of Nuclear Energy in Stabilizing CO2 Emissions • Nuclear energy is on tap, but not on top; continued successful operation of present LWRs crucial to preserve if not to improve this status; • The reality and rate of approaching any viable, CO2-impacting nuclear-energy future is dependent on: - overcoming barriers to public acceptance (waste, proliferation, safety, cost; in order of decreasing concern); - global shifts in energy demand and growths; - economics of financing large capital-intensive technologies.
Conclusions: Role of Nuclear Energy in Stabilizing CO2 Emissions (cont.-1) • Nuclear energy can play an important, although not dominant, role in CO2 reduction strategies; - In both the BAU-BO and BAU-PO scenarios, CO2 emission rates increase continuously throughout the next century, reaching levels 143% and 174% higher than in 1990, respectively. - In the ED-PO scenario, CO2 emission rates are essentially stabilized, but at a level 34% above 1990 levels. - Only in the ED-BO scenariois the CO2 emission rate decreased, being 5% lower in 2095 than in 1990.
Conclusions: Role of Nuclear Energy in Stabilizing CO2 Emissions (cont.-2) • Nuclear capacity in the year 2100 reaches about 3,900 GWe in the BAU-BO scenario and about 6,700 GWe in the ED-BO scenario, or some 9 to 15 times, respectively, the capacity in operation as of 2000. • Annual nuclear capacity additions reach a maximum of some 55 GWe/yr in the BAU-BO scenario and around 95 GWe/ye in the ED-BO scenario. Based on past experience, with some 40 GWe/yr of capacity having been added in some years, these levels of capacity addition are feasible, although significant expansion beyond the nuclear plant manufacturing capability existing today will be required.