Download
1 / 45
450 likes | 570 Views
Costs and Profit. 1. Profit determination Revenue. Costs and Profit. 1. Profit determination Revenue- Income earned from sales. Total Revenue – Gross income from all sales. Costs and Profit. 1. Profit determination Profit. Costs and Profit. 1. Profit determination Profit-

E N D
Costs and Profit 1. Profit determination Revenue
Costs and Profit 1. Profit determination Revenue- Income earned from sales. Total Revenue – Gross income from all sales
Costs and Profit 1. Profit determination Profit
Costs and Profit 1. Profit determination Profit- The amount remaining when costs are subtracted from revenue.
Costs and Profit 1. Profit determination Costs • Explicit Costs • Implicit Costs
Costs and Profit • Profit determination Costs • Explicit Costs Explicit costs involve an actual payment of money b) Implicit Costs
Costs and Profit • Profit determination Costs • Explicit Costs Explicit costs involve an actual payment of money b) Implicit Costs Implicit costs are those that you know you bear, but you do not actually pay.
Costs and Profit Revenue - Explicit Costs Financial Profit (or Accounting Profit, or Simple Profit)
Costs and Profit Revenue - Explicit Costs Financial Profit (or Accounting Profit, or Simple Profit) - Implicit Costs Economic Profit
Costs and Profit Four major costs All of the major costs are Explicit Costs
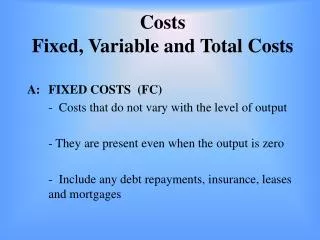
Costs and Profit Four major costs Fixed Cost (FC)
Costs and Profit Four major costs Fixed Cost (FC) – Costs that remain the same as the number of units produced changes.
Costs and Profit Four major costs Fixed Cost (FC) Variable Cost (VC)
Costs and Profit Four major costs Fixed cost (FC) Variable cost (VC) Costs that change as the number of units produced changes
Costs and Profit Four major costs Fixed Cost (FC) Variable Cost (VC) Total Cost (TC)
Costs and Profit Four major costs Fixed Cost (FC) Variable Cost (VC) Total Cost (TC) The total cost of production, equal to Fixed Cost plus Variable Cost (FC + VC = TC)
Costs and Profit Four major costs Fixed Cost (FC) Variable Cost (VC) Total Cost (TC) Marginal Cost (MC)
Costs and Profit Four major costs Fixed Cost (FC) Variable Cost (VC) Total Cost (TC) Marginal Cost (MC) The cost of producing one additional unit. The formula for marginal cost is MC = ∆ TC/ ∆ Units
Costs and Profit Three minor costs Average Fixed Cost (AFC)
Costs and Profit Three minor costs Average Fixed Cost (AFC) Fixed cost divided by units produced
Costs and Profit Three minor costs Average Fixed Cost (AFC) Average Variable Cost (AVC)
Costs and Profit Three minor costs Average Fixed Cost (AFC) Average Variable Cost (AVC) Variable Cost divided by units produced
Costs and Profit Three minor costs Average Fixed Cost (AFC) Average Variable Cost (AVC) Average Total Cost (ATC)
Costs and Profit Three minor costs Average Fixed Cost (AFC) Average Variable Cost (AVC) Average Total Cost (ATC)- Total Cost divided by units produced (or AFC + AVC = ATC)
Costs and Profit The Point of Diminishing Returns– That point in a continuing production setting where the continued application of variable cost resources results in production beginning to increase at a decreasing rate.
Costs and Profit Long Run and Short Run are not specific time periods. The “Short Run” is a production period that is too short to allow for fixed-cost assets to be changed. The “Long Run” is an average of two or more short run scenarios. Production always takes place during a short run.
Costs and Profit Returns to Scale In a production setting, costs are accounted for in constant amounts. Rather than figuring out how much each unit costs, businesses keep track of how many units are produced per dollar (or thousand dollars, or million dollars). This increment of costs is referred to as the “scale” by which we measure production. The units produced are referred to as “returns to scale”.
Costs and Profit Returns to Scale There are three possible “returns”. Increasing (positive) returns to scale – When each additional dollar spent results in more additional units being produced.
Costs and Profit Returns to Scale There are three possible “returns”. Increasing (positive) returns to scale – When each additional dollar spent results in more additional units being produced. Constant (neutral) Returns to Scale - When each additional dollar spent results in the same number of additional units being produced.
Costs and Profit Returns to Scale There are three possible “returns”. Increasing (positive) returns to scale – When each additional dollar spent results in more additional units being produced. Constant (neutral) Returns to Scale - When each additional dollar spent results in the same number of additional units being produced. Decreasing (negative) Returns to Scale - When each additional dollar spent results in fewer additional units being produced.
Costs and Profit Returns to Scale When viewed on the Average Total Cost (ATC) curve, the three sections are fairly obvious. As long as the curve is descending, we are in the Increasing Returns range.
Costs and Profit Returns to Scale When viewed on the Average Total Cost (ATC) curve, the three sections are fairly obvious. As long as the curve is descending, we are in the Increasing Returns range. When the curve levels and is parallel to X, we are in the Constant Returns range.
Costs and Profit Returns to Scale When viewed on the Average Total Cost (ATC) curve, the three sections are fairly obvious. As long as the curve is descending, we are in the Increasing Returns range. When the curve levels and is parallel to X, we are in the Constant Returns range. When the curve begins to rise, we are in the Decreasing Returns range.
Costs and Profit Returns to Scale Using the Average Total Cost (ATC) curve, it is also easy to identify the area of greatest efficiency of production. This is known as “Economy of Scale”.
Costs and Profit Economy of Scale Cost savings that are due to a firms large size or high levels of production output. There are four things that result in cost savings that large firms can do, and smaller firms cannot. These are the four reasons for Economy of Scale.
Costs and Profit Economy of Scale Four reasons for Economy of Scale Bulk Rate Discounts
Costs and Profit Economy of Scale Four reasons for Economy of Scale Bulk Rate Discounts Efficient Use of Human Resources
Costs and Profit Economy of Scale Four reasons for Economy of Scale Bulk Rate Discounts Efficient Use of Human Resources Efficient Use of Capital Equipment
Costs and Profit Economy of Scale Four reasons for Economy of Scale Bulk Rate Discounts Efficient Use of Human Resources Efficient Use of Capital Equipment Efficient Use of By-Products
Costs and Profit Profit Determination There are two basic methods of calculating profit, and determining the most profitable point of production (PMLP –profit maximizing level of production). Total Cost basis Marginal Cost basis


![Target Profit Price = total costs [at Level X] + Target profit](https://cdn3.slideserve.com/6116031/slide1-dt.jpg)