Download
1 / 16
160 likes | 273 Views
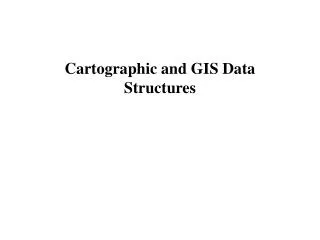
Geography 409 Advanced Spatial Analysis and GIS Principles of Effective Cartographic Design - 3 - Julia Siemer U of R, Winter 2006. Graphic variables (Jaques Bertin). Shape. Size. Colour (hue). Colour (value). Texture. Points. Lines. Areas. Cartogram. Cartogram.

E N D
Geography 409 Advanced Spatial Analysis and GIS Principles of Effective Cartographic Design - 3 - Julia Siemer U of R, Winter 2006
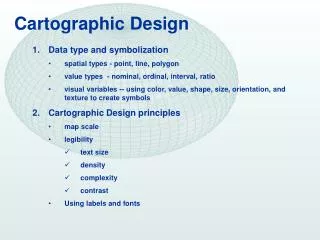
Graphic variables (Jaques Bertin) Shape Size Colour (hue) Colour (value) Texture Points Lines Areas Cartogram Cartogram qualitative & quantitative differences qualitative differences quantitative differences qualitative differences quantitative differences
Point symbols Basic distinctions • Pictographic symbols - Associations, resemblance - Conventions
Point symbols Basic distinctions • Geometric Symbols • Primary symbols • Secondary symbols G
Point symbols Basic distinctions • Up to three variables stress level Quality of Life unemploy- ment affluence low high
Typography What type to use? • Type variables: style, weight, form, size Computer screen: e.g. Trebuchet, Verdana Paper: e.g. Times, Helvetica (Arial) • Use type variations to communicate information Lake INDEPENDENT CITY Suburb Wascana Park
4 6 2 3 5 1 7 8 Typography Type placement - points 1) Right of the symbol 2) Above the symbol 3) Left of the symbol 4) Below the symbol
Typography Type placement - points
Typography Type placement - areas
Typography Type placement - areas
Typography Type placement
Typography Type placement
Typography Type placement
Finish your map • Critiquing your map - Does your map do what you want it to do? - Is your map suitable for your intended audience? Will they be confused, bored, interested, or informed? - Does the map reproduce well on its final medium? Has the potential of a black-and-white or colour design been reached? • Undertake a systematic critique, then redesign the map! • Critiquing your data • Critiquing titles and legends • Critiquing the map design
Further reading • Cartography • Campbell, John (2001): Map Use and Analysis. 4. Edition • Dent, Borden D. (1999): Cartography. Thematic Map Design. 5. Edition • Krygier, John and Denis Wood (2005): Making Maps. A Visual Guide to • Map Design for GIS • Muehrcke, Phillip C. and Juliana O. Muehrcke (1998): Map Use. Reading, Analysis, • and Interpretation. 4. Edition. JP Publications. • Robinson, Arthur H. et al. (1995): Elements of Cartography. 6. Edition • Slocum, Terry et al. (2004): Thematic Cartography and Geographic Visualization • Graphics/Graphic Design Bertin, Jacques (1984): Semiology of Graphics. Diagrams, Networks, Maps Tufte, Edward R. (1990): Envisioning Information Tufte, Edward R. (1983): The Display of Quantitative Information