Download
1 / 16
160 likes | 259 Views
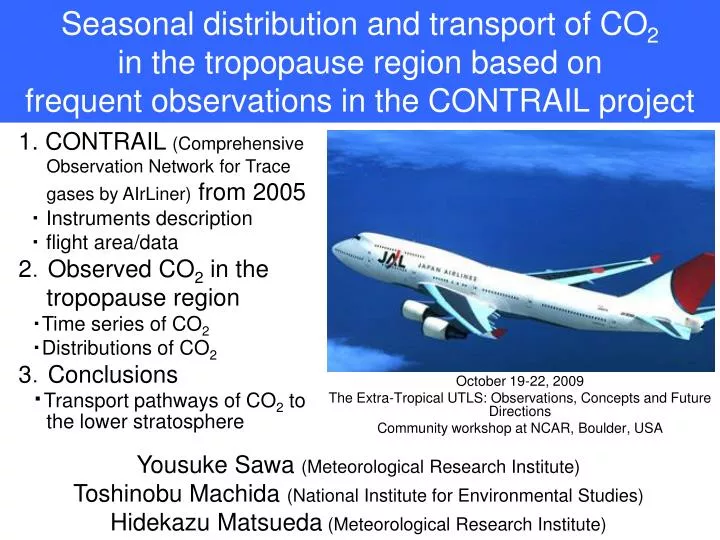
1. CONTRAIL (Comprehensive Observation Network for Trace gases by AIrLiner) from 2005 ・ Instruments description ・ flight area/data 2 . Observed CO 2 in the tropopause region ・ Time series of CO 2 ・ Distributions of CO 2 3 . Conclusions

E N D
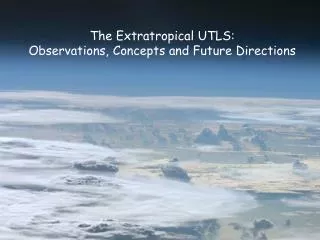
1. CONTRAIL (Comprehensive Observation Network for Trace gases by AIrLiner) from 2005 ・ Instruments description ・ flight area/data 2.Observed CO2 in the tropopause region ・Time series of CO2 ・Distributions of CO2 3.Conclusions ・Transport pathways of CO2 to the lower stratosphere Seasonal distribution and transport of CO2in the tropopause region based on frequent observations in the CONTRAIL project October 19-22, 2009 The Extra-Tropical UTLS: Observations, Concepts and Future Directions Community workshop at NCAR, Boulder, USA Yousuke Sawa (Meteorological Research Institute) Toshinobu Machida (National Institute for Environmental Studies) Hidekazu Matsueda (Meteorological Research Institute)
CO2 as a transport tracer CO2 (9-12km) • CO2 is very stable in the atmosphere • CO2 has (relatively) well-known seasonal cycles depending on the latitudes • CO2 can be used as a transport tracer (between Australia and Japan) Matsueda et al., 2002, 2008
New instruments: development forCONTRAIL Wide range, High frequency Latitudinal/Longitudinal Distribution Vertical Distribution Vertical Distribution • Ascending/descending: 10 sec average (~80m vertical) • Cruising altitudes:1 min average • (~15 km horizontal) • Detailed structures Continuous CO2 Measurement Equipment (CME) • Functions: • in-situ CO2 measurement • 1-2 month continuous observation • real time control by aviation information (ARINC) • Onboard calibrations high accuracy 0.2 ppm • Machida et al., 2008
CONTRAIL CO2 Data set 2005 Nov. – 2009 Mar.(3212 legs) CO2 1-min data: ~1 million data Altitude: 8-12 km Main routes for analysis • Between Europe and Japan • 680 legs • almost every day from November 2006 to Mar. 2008. Number of data (/day) between North America and Japan
2006122100UT 330K Examples of observed CO2 December, 2006 Meteorological Re-analysis Data (JCDAS) CO2 were well corresponded to the PVs Significant variations Tropospheric or stratospheric ?
Analytical Methods Vertical coordinate: Latitudinal coordinate: ΔΘ:differences in potential temperature North Pole =20K Equivalent Latitude Lower stratosphere =10K =0K (Tropopause =2 PVU) =-10K Equator =-20K Upper troposphere Hegglin et al., 2006 Hoor et al., 2004 Reanalysis data JMA Climate Data Assimilation System (JCDAS) Same system as JRA-25 (Onogi et al., 2007) T106, L40, 6hr
Oct. Dec. Vertical profiles of CO2by reference to 25K 0K (from flights between Europe and Japan) Mar. May Aug. Sep. Above tropopause, the CO2 shows different vertical gradients above and below of about 25K. CO2 (ppm) CO2 (ppm)
between Japan and North America Time series of CO2 for each bin between Japan and Europe Upper troposphere: a strong seasonal cycle maximum in spring minimum in summer Lower stratosphere: a gradual decrease in winter and spring followed by a rapid increase in summer Seasonal cycle of CO2 in LS Max.: September Min.: April Amplitude: 1.2 ppm (=20-30K) 1.8 ppm (=30-40K) 2.2 ppm (=40-50K)
Winter:CO2//Θ, CO2//ΔΘ July 2007 Aug 2007 Sep. 2007 ΔΘ=0 ΔΘ=0 ΔΘ=0 Summer:CO2//Θ, CO2//ΔΘ Seasonal changes of CO2 distributions Mar. 2007 Oct. 2006 Descent of low CO2 uniformly distributed Potential Temperature ΔΘ=0 ~constant CO2 (ppm) → Equivalent Latitude Rapid meridional transport of high CO2 form lower latitudes
CO2 distributions in summer 2008 between Japan and Europe CO2 distributions in summer 2007 between Japan and North America
340<<360K Jul. 2007 Longitudinal difference ? W C E 10W-50E (W) 50-110E (C) 110-150E (E) Aug. Sep. Jul. May Jun.
2007 Jan 2007 Mar CONTRAIL-Transport model intercomparisonNiwa et al. CO2 by NICAM-gl6 (Niwa@CCSR/Tokyo Univ.) 2007 Jul 2007 Aug 2007 Sep Potential temperature Equivalent latitude→ the courtesy of Niwa(CCSR/Tokyo Univ.), Patra(JAMSTEC)
Conclusions:Transport pathways of CO2 to the lower stratosphere • Frequent CO2 observations were made in the tropopause region by using JAL airliners. • Rapid CO2 increases were found in the summer in the lower stratosphere, followed by gradual decreases from winter to spring. • CO2 distributions in - coordinates suggest the existence of a rapid meridional transport on potential temperature surfacesin summer, and a subsidence of air from higher altitudes in winter to spring. • More JAL observations could provide new evidences about the meridional transport pathways, such as relationships to the monsoon circulation.
How to access CONTRAIL CO2 data-> Contact us! • CME data • request -> PIs • PIs -> data protocol -> data user • data user -> agreement, description of the study, members -> PIs • PIs -> CO2 data set -> data users • Short annual report -> PIs • contact the PIs to discuss the results as well as co-authorship and collaboration before presentation or publication • ASE CO2 data are submitted to • WDCGG (WMO world data center for greenhouse gases) • globalview CO2 (processed by Dr. Masarie @ NOAA/GMD) • Related projects: • CONTRAIL TMI (Transport model intercomparison) among CCSR/Tokyo Univ., MRI/JMA, JAMSTEC, NIES • GOSAT validation • many Carbon cycle model studies,… tmachida@nies.go.jp hmatsued@mri-jma.go.jp ysawa@mri-jma.go.jp
747-Classic 1993~2005 for ASE 747-400 2005~ for ASE and CME Thank you 777-200 2006~ for CME
References • Machida et al. (2008): Worldwide measurements of atmospheric CO2 and other trace gas species using commercial airlines, J. Atmos. Oceanic. Technol. 25(10), 1744-1754, DOI: 10.1175/2008JTECHA1082.1. • Matsueda et al.(2008): Evaluation of atmospheric CO2 measurements from new flask air sampling of JAL airliner observation, Pap. Meteorol. Geophys. 59, 1-17. • Sawa, Y., T. Machida, H. Matsueda (2008): Seasonal variations of CO2 near the tropopause observed by commercial aircraft, J. Geophys. Res., 113, D23301, doi:10.1029/2008JD010568. Acknowledgements We would like to acknowledge many engineers of the Japan Airlines, JAL Foundation and JAMCO Tokyo for supporting our CONTRAIL project. The CONTRAIL project is financially supported by the Research Fund by Global Environmental Research Coordination System of the Ministry of the Environment in Japan.