Download
1 / 11
110 likes | 285 Views
Chemistry of Aerosols. Analyzing the composition of aerosols collected on Mt. Pico. Photo: L. Harkness. Describe how the high volume sampler works. Write observations of the filters. Video Notes:. Video: Collecting Aerosols with the samplers. Click here for the video!!.

E N D
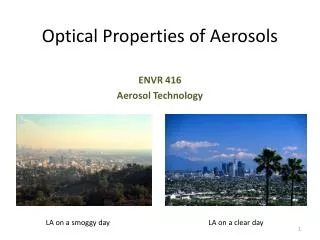
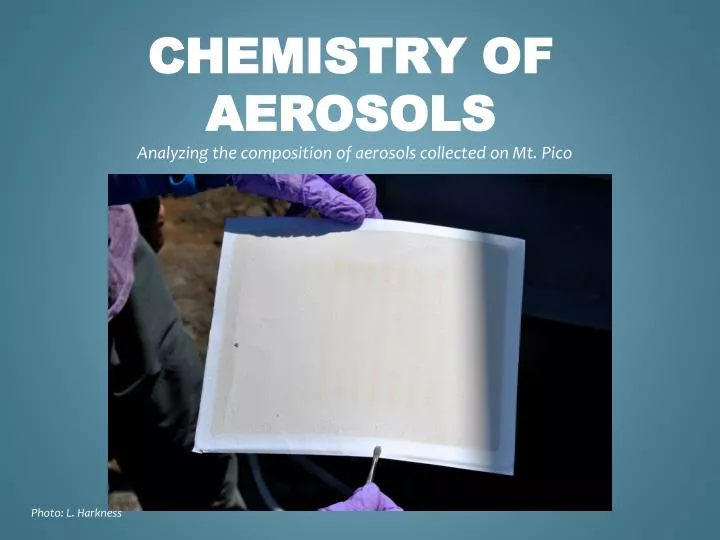
Chemistry of Aerosols Analyzing the composition of aerosols collected on Mt. Pico Photo: L. Harkness
Describe how the high volume sampler works. • Write observations of the filters. Video Notes:
Video: Collecting Aerosols with the samplers Click here for the video!! Video: L. Harkness
Describe how instruments and filters are prepared. • How does the OC/EC work? • What do the colored lines on the screen represent? Video Notes:
Video: Analyzing Filter Samples for Carbon Click here for the video!! Video: L. Harkness
Analyze graphs of OC data from various dates • Research the weather that day and previous 5 days • From which land mass could the aerosols have come from? • Research any possible events that would cause high levels of organic aerosols around that date. Today’s Tasks:
www.wunderground.com Search “Pico, Portugal” History – go to day of event and the days prior; look at wind direction • http://fires.globalincidentmap.com/home.php Put in date range and check for fires in North America Sites to use:
Global Atmospheric Circulation http://www.lsrhs.net/departments/science/faculty/brandesa/images/winds.jpg
Examples of Data: Graph provided by: S. Schum
Examples of Data: Graph provided by: S. Schum
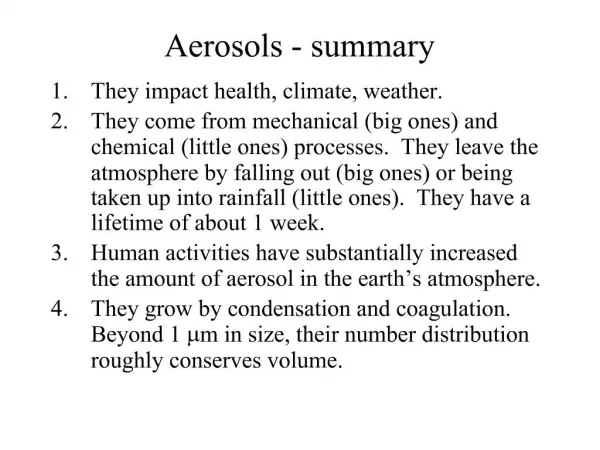
The difference between an event and a non-event is the amount of carbon in micrograms per cubic meter • OC (organic carbon): soot, carbon from life sources (decomposition, trees – oils, burning, marine organisms) • EC (elemental carbon): similar to graphite Examples of Data: