Download
1 / 1
10 likes | 84 Views
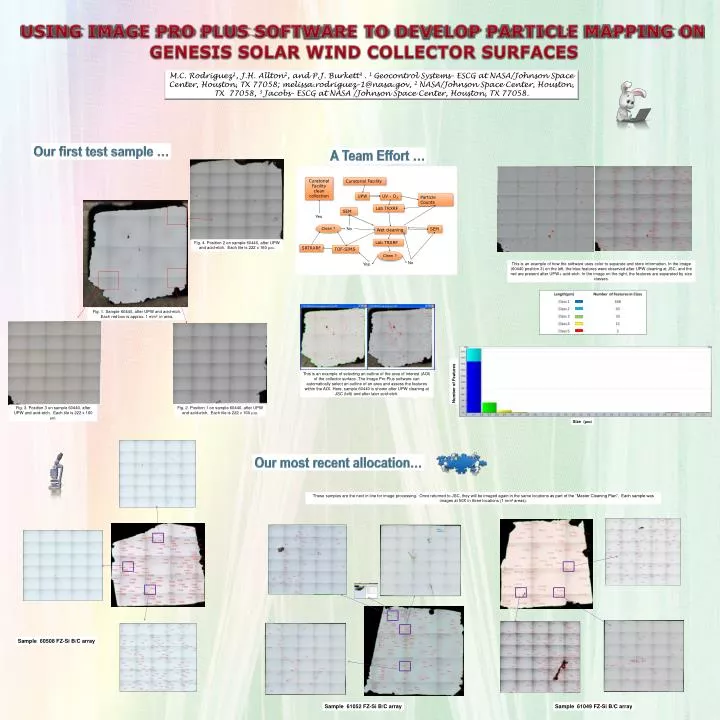
Curatorial Facility clean collection. Curatorial Facility. UPW. UV - O 3. Particle Counts. USING IMAGE PRO PLUS SOFTWARE TO DEVELOP PARTICLE MAPPING ON GENESIS SOLAR WIND COLLECTOR SURFACES. Lab TRXRF. SEM. Yes. Clean ?. No. SEM. Wet cleaning. Lab TRXRF. SRTRXRF. TOF-SIMS.

E N D
Curatorial Facility clean collection Curatorial Facility UPW UV - O3 Particle Counts USING IMAGE PRO PLUS SOFTWARE TO DEVELOP PARTICLE MAPPING ON GENESIS SOLAR WIND COLLECTOR SURFACES Lab TRXRF SEM Yes Clean ? No SEM Wet cleaning Lab TRXRF SRTRXRF TOF-SIMS M.C. Rodriguez1, J.H. Allton2, and P.J. Burkett3 . 1 Geocontrol Systems- ESCG at NASA/Johnson Space Center, Houston, TX 77058; melissa.rodriguez-1@nasa.gov, 2 NASA/Johnson Space Center, Houston, TX 77058, 3 Jacobs- ESCG at NASA /Johnson Space Center, Houston, TX 77058. Clean ? No Yes Our first test sample … A Team Effort … This is an example of selecting an outline of the area of interest (AOI) of the collector surface. The Image Pro Plus software can automatically select an outline of an area and assess the features within the AOI. Here, sample 60440 is shown after UPW cleaning at JSC (left) and after later acid-etch. Fig. 4. Position 2 on sample 60440, after UPW and acid-etch. Each tile is 222 x 160 µm. This is an example of how the software uses color to separate and store information. In the image (60440 position 3) on the left, the blue features were observed after UPW cleaning at JSC, and the red are present after UPW+ acid-etch. In the image on the right, the features are separated by size classes. Fig. 1. Sample 60440, after UPW and acid-etch. Each red box is approx. 1 mm2 in area. Fig. 2. Position 1 on sample 60440, after UPW and acid-etch. Each tile is 222 x 160 µm. Fig. 3. Position 3 on sample 60440, after UPW and acid-etch. Each tile is 222 x 160 µm. Our most recent allocation… These samples are the next in line for image processing. Once returned to JSC, they will be imaged again in the same locations as part of the “Master Cleaning Plan”. Each sample was images at 50X in three locations (1 mm² areas). Number of Features Size (µm) Sample 60508 FZ-Si B/C array Sample 61052 FZ-Si B/C array Sample 61049 FZ-Si B/C array