Download
1 / 26
260 likes | 269 Views
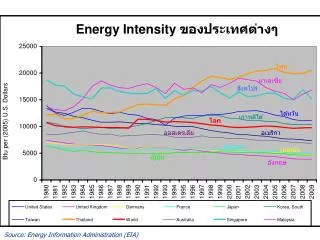
Current Power and Energy Landscape. Glen Sweetnam Energy Information Administration. Post Petroleum Energetics Conference McLean, VA June 17, 2008. International Energy Outlook: Major Trends. World energy use is expected to rise by 57 percent between 2004 and 2030.

E N D
Current Power and Energy Landscape Glen Sweetnam Energy Information Administration Post Petroleum Energetics Conference McLean, VA June 17, 2008 1
International Energy Outlook: Major Trends • World energy use is expected to rise by 57 percent between 2004 and 2030. • Non-OECD Asia (especially China and India) energy use is expected to increase by 136%. • The Middle East accounts for substantial shares of the world’s increase in liquids (45% of the world total) and natural gas (22%) • High world oil prices encourage the production of unconventional liquids; 10.5 million barrels per day or 9% of total liquids supply by 2030. • Coal is the fastest growing energy sources worldwide - increasing by 2.2% per year. Natural gas and renewables each increase by 1.9% per year. Liquids grow by 1.4% per year. • Despite high oil and gas prices, liquids and natural gas are expected to provide 58% of the world’s primary energy in 2030. • Energy-related carbon dioxide emissions increase by 60 percent between 2004 and 2030. 2
World Marketed Energy Use: OECD and Non-OECD History Projections 404 Non-OECD 298 OECD 240 207 3 Source: EIA, IEO2007
Average Annual GDP and Population Growthfor Selected Regions, 2004-2030 4 Source: EIA, IEO2007
World Electric Power Generation by Region, 1980-2030 17.2 Non-OECD 13.2 OECD 9.5 7.0 History Projections 5 Source: EIA, IEO2007
World Oil Prices in Three World Oil Price Cases, 1980-2030 $157 $95 $58 History Projections 6 Source: EIA, AEO2007
World Electricity Generation by Fuel 7 Source: EIA, IEO2007
World Marketed Energy Use by Fuel Type History Projections 34% Liquids 28% 38% Coal 24% Share of World Total Natural Gas 26% 23% Renewables 8% 7% 6% Nuclear 6% 8 Source: EIA, IEO2007
World Liquids Consumption by Region, 2004 and 2030 7.0 15.0 0.2 Increase in million b/d 0.8 4.3 4.1 1.5 2.1 9 Source: EIA, IEO2007
2005 Proved Oil Reserves and Projected Total Liquids Consumption from 2004 through 2030 (billion barrels) 10 Source: I.H.S. Energy, 2007
Estimated Reserve Ownership - 2006 6 % 6 % 11 % 77 % World Wide Proven Oil Reserves: 1,148 Billion Barrels 11 Source: PFC Energy, 2006
World Liquids Production, 2004-2030 118 Total Non-OPEC (Conventional) 54 53 OPEC (Conventional) Unconventional 10 12 Source: EIA, IEO2007
Non-OPEC Producing Regions With More than a One Million Barrel Per Day Increase in Total Production Over the Forecast Period, 2005 and 2030 13 Source: EIA, IEO2007
OPEC Conventional Liquids Production 14 Source: EIA, IEO2007
World Unconventional Liquids Production in the Reference Case, 1980-2030 Projections History Note: “Other” includes shale oils and other unidentified sources of unconventional liquid fuels. Source: EIA, IEO2007 15
World Coal Consumption, 2004-2030 16 Source: EIA, IEO2007
World Natural Gas Consumption, 2004-2030 17 Source: EIA, IEO2007
World Natural Gas Production by Region, 2004-2030 18 Source: EIA, IEO2007
167 2,549 490 415 545 2,020 World Natural Gas Reserves, 2008 (trillion cubic feet) Source: Oil & Gas Journal, “Worldwide Look at Reserves and Production,” December 24, 2007, pp. 25-28 19
World Renewable Energy Use, 2004-2030 OECD Non-OECD 20 Source: EIA, IEO2007
World Nuclear Generating Capacity by Region, 2004 and 2030 21 Source: EIA, IEO2007
World Energy-Related Carbon Dioxide Emissions by Fuel Type Projections History Total 43 Coal 36 Liquids 40 21 39 Natural Gas 20 22 Source: EIA, IEO2007
World Carbon Dioxide Emissions by Region 23 Source: EIA, IEO2007
Oil prices have varied widely over the last 100 years 24 Source: BP Statistical Review of World Energy, June 2007 (1970-1980); EIA, AEO2007
What’s Different This Time First period totals do not add due to inventory changes, refinery gain, and rounding 25
Periodic Reports Petroleum Status and Natural Gas Storage Reports, weekly Short-Term Energy Outlook, monthly Annual Energy Outlook 2007, February 2007 International Energy Outlook 2007, May 2007 Examples of Special Analyses Long-term Oil Scenarios, Looking Beyond 2030, April 2008 Why are Oil Prices So High, November 2007 The Global Liquefied Natural Gas Market: Status and Outlook, Dec 2003 “Restricted Natural Gas Supply Case,” Annual Energy Outlook 2005 www.eia.doe.gov Glen Sweetnam glen.sweetnam@eia.doe.gov 26