Download
1 / 49
490 likes | 497 Views
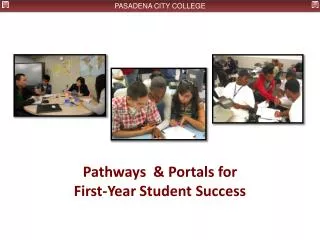
Pathways to Trinity: The Disabled Student Journey – a new transition model is emerging Alison Doyle, Declan Reilly, Declan Treanor. DS background.

E N D
Pathways to Trinity: The Disabled Student Journey – a new transition model is emerging Alison Doyle, Declan Reilly, Declan Treanor
DS background • The Disability Service currently supports 911 students with a disability with a retention rate of 93%; in addition 66% of graduands with a disability achieved a first class or upper second class degree last year; • 346 student registered with the service in 2011-12; • 240 students graduated in 2011-12; • Demographics – all countries represented except Derry (51% Dublin); • International students – 11% with 16 countries represented (UK 5%, USA 2%...)
Disability profile • Breakdown by disability type differs from national data (Ahead 2011); • Dyslexia (SpLD) 34% (60%); • Mental Health 17% (9%); • S O Illness 10% (10%) • Physical 10% (7%); • ADHD 7% (2%) • Asperger’s Syndrome 4% (2%) • Deaf/HH 4% (3%) • Blind/VD 2% (2%)
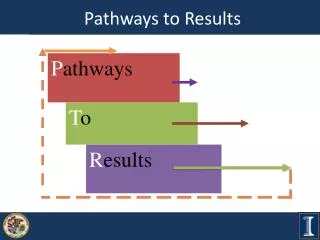
Proactive Model The Student Journey Pathway to employment Stage 3: Transition to further study or employment Pathway to College Stage 1: Pre-entry, admission and the first year experience. Pathway through College Stage 2: Building and maintaining a college career. Disability Service Outreach, Transition, Retention and Progression Plan 2011 – 2014
Policy context National Policy – HEA Access Plan 2008-2013 TCD Strategic Plan - 2009-2014, TCD Access Plan 2009-13 The OECD (2011) final review of international policy and practice for students with disabilities engaging in higher education and / or employment activities post-secondary school. • Promoting equity as a responsibility of educational institutions • Empowering second level students and schools to ensure inclusion • Promoting an education system that focuses on every student’s success • Making a move towards integrated transition systems
Stage I – Pre-entry & 1st year experience The Student Journey Pathway to employment Stage 3: Transition to further study or employment Pathway to College Stage 1: Pre-entry, admission and the first year experience. Pathway through College Stage 2: Building and maintaining a college career. Disability Service Outreach, Transition, Retention and Progression Plan 2011 – 2014
Pathways to Trinity: a modelled pre-entry and first year initiative to support disabled students in the process of transition from school to college.
http://www.heacademy.ac.uk/assets/documents/what-works-student-retention/What_Works_Compendium_Effective_Practice.pdfhttp://www.heacademy.ac.uk/assets/documents/what-works-student-retention/What_Works_Compendium_Effective_Practice.pdf
Pathways to Trinity (www.tcd.ie/pathways-to-trinity) 1) Act as a repository for information relevant to all aspects of the application and admissions process for students with disabilities. 2) Provide access to study skills and assistive technology resources which will facilitate a level of academic competency and confidence around transition into the first year of college. 2) identify issues related to transition from senior cycle education.
Research • Concurrent-transformative-triangulated-convergent Mixed Methodology. • Equal quantitative and qualitative weighting. • Merged results from two sequential phases. Respondents n = 71 Respondents n = 43 Respondents n = 1
Academic ‘readiness’ http://www.palgrave.com/skills4studycampustaster/An_introduction.html
Transition support workshops Monthly workshops, Wednesday 2pm – 4pm, 6th year students and parents October 2011 – May 2012. Opportunities to: • Explore the nature of their own learning style, • Develop effective study skills, • Actively partake in planning their own transition to college, • Navigate through the Disability Access Route to Education (DARE) process, • Succeed during the exam period including effective use of reasonable accommodations, exam technique and stress management techniques.
Stage II – Retention and Progression The Student Journey Pathway to employment Stage 3: Transition to further study or employment Pathway to College Stage 1: Pre-entry, admission and the first year experience. Pathway through College Stage 2: Building and maintaining a college career. Disability Service Outreach, Transition, Retention and Progression Plan 2011 – 2014
Stage 2. Building and maintaining a college career … striking a balance Declan Reilly
Supports for students with disabilities are defined by policies and practices which provide reasonable accommodations at individual, course and College level. Support
Independence is defined as greater self autonomy in decisions which affect a student. Striking a balance between ‘providing support’ and ‘encouraging independence’ need not be a conflict of interests if the supports offered adjust to the student’s needs as they proceed through College. Independence
Retention and progression are recognised as important outcome measures of higher education internationally (Tinto,1993), (Yorke,1999), (HESA, 2011), (Seidman,2012). Retention and Progression
DS Policy over 10 years • Responded to the needs of students over the short to medium term (up to 6 months).These practical supports were successful in assisting students and developing the service. • But policy neglected problems prior to 3rd level, limited scope for independence and neglected issues of employment. • New policy is to continue to provide supports to students with disabilities but develop new initiatives in line with the 3 stages of transition into, through and from TCD.
Retention in TCD The retention rate of students in TCD is 85% annually. The retention rate of students with a disability in TCD is 93%. Overall, more students withdraw from College after attempting to repeat JF year than withdraw during their first year! www.tcd.ie/vpcao/council/senior-lecturer-reports.php
Persistence and disability • Students with mental health difficulties or who are Deaf or hard of hearing are most likely to withdraw. Students with ADHD, DCD or who are blind or visually impaired are least likely to withdraw. • 9.5% of students with disabilities are international students compared to 21.5% of the general student population in TCD. • Students with disabilities from the US are more likely to withdraw than students with disabilities from the UK by a ratio of 7 to 1
Grade comparison • Students with disabilities in TCD are less likely to achieve a 1st or 2.1 exam result and more likely to achieve a 2.2 or pass. • Reasons: supports are more sought after by students who are at risk of failing and the facility to repeat on medical grounds is more likely to be taken up by students with disabilities
In common with other HEIs*… • Students are more likely to leave in their first year.* • Students with disabilities are more likely to take longer to graduate.* • Students with disabilities are more likely to graduate than their non disabled peers. *Students with Disabilities Tracking Report – 2005 intake
Students with disabilities in TCD... • ..have a higher rate of retention and course completion than their peers. • ..with a mental health difficulty have the highest risk of withdrawing. • ..are more likely to take longer to complete their degree. • ..are more likely to attain grades of 1 and 2.1 in proportionately lower numbers than their peers.
Develop new systems • Early identification: pathways website, DARE, needs assessment. • Identify ‘at risk’ students based on previous students in TCD with difficulties. • Work with other areas in TCD to enhance current supports. • Develop new systems to reflect new DS strategies. • Self assessment system to alert students to seek support. • Improved data management to enable greater student autonomy i.e. Student ownership of supports. • Anticipate needs as students progress. • Academic skills modules.
Stage III – T2E The Student Journey Pathway to employment Stage 3: Transition to further study or employment Pathway to College Stage 1: Pre-entry, admission and the first year experience. Pathway through College Stage 2: Building and maintaining a college career. Disability Service Outreach, Transition, Retention and Progression Plan 2011 – 2014
Aims • To investigate the experiences of disabled students in transitioning into employment. 2. To evaluate the transition to employment tool and determine if it will work in a university to employment setting. • To critique employer issues in the employment of disabled graduates and determine national policy issues required to allow for greater employment opportunities.
Lack of data • HEA First Destination Report (FDR) does not ask any specific disability questions; • Data is gathered in different ways amongst the few HEIs that do so; • UCC, UL & TCD: ‘Were you a student with support requirements (for example disability)’. Yes/No response choice.
FDR 2010 TCD • Total completed 1, 743 (59%). • 85 (2.9%) were disabled graduates. • Of this group: • 29% did not respond • 39% were in employment • 25% were in further study • 2% were not available for work • 5% were seeking employment
Graduates with disabilities more likely to go into employment (55% against 42% of total final year cohort) but less likely to go into further study (35% against 49% of total final year cohort); • There is a slight difference in unemployment rate, with 7% of graduates with disabilities seeking employment compared to 5% of total final year cohort.
Project aims Develop an employment support and guidance assessment tool for students with disabilities which combines success in higher education and access to employment.
Key Employment Needs Interview Preparation and Skills Student Employment Needs Dealing With Disclosure Fitness to Practice • Application Preparation • Cover Letters • CV Preparation Identifying Potential Employers Reasonable Accommodations and Information on Funding
Success of Project to Date • Employment Offers
Proactive structure: strategic plan The Student Journey Pathway to employment Stage 3: Transition to further study or employment Pathway to College Stage 1: Pre-entry, admission and the first year experience. Pathway through College Stage 2: Building and maintaining a college career. Implement – Review - Develop
Paper and presentation downloadable at: • http://www.tcd.ie/disability/banner/Links/Conf-papers.php