Download
1 / 54
570 likes | 737 Views
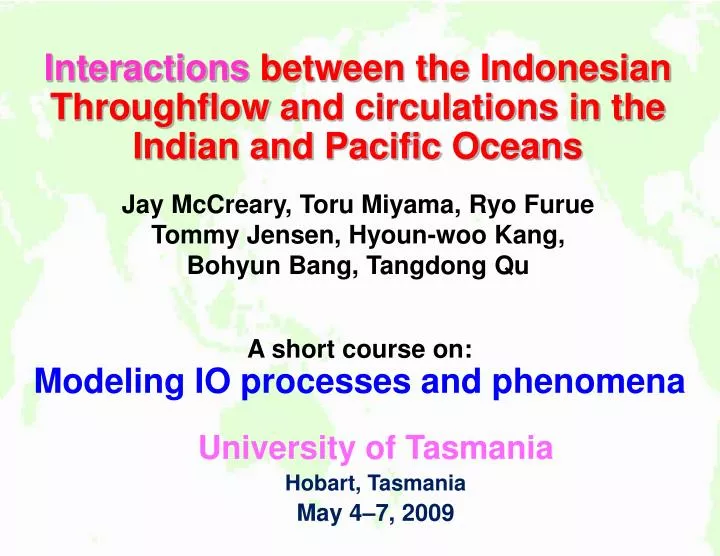
Interactions between the Indonesian Throughflow and circulations in the Indian and Pacific Oceans. Jay McCreary, Toru Miyama, Ryo Furue Tommy Jensen, Hyoun-woo Kang, Bohyun Bang, Tangdong Qu. A short course on: Modeling IO processes and phenomena. University of Tasmania

E N D
Interactions between the Indonesian Throughflow and circulations in the Indian and Pacific Oceans Jay McCreary, Toru Miyama, Ryo Furue Tommy Jensen, Hyoun-woo Kang, Bohyun Bang, Tangdong Qu A short course on: Modeling IO processes and phenomena University of Tasmania Hobart, Tasmania May 4–7, 2009
References • (PTNE) McCreary, J.P., T. Miyama, R. Furue, T. Jensen, H.-W. Kang, B. Bang, and T. Qu, 2007: Interactions between the ITF and circulations in the Indian and Pacific Oceans. Prog. Oceanogr., 75(1), 70–114. • Godfrey, J.S., and A.J. Weaver, 1991: Is the LC driven by Pacific heating and winds? Prog. Oceanogr., 27, 225–272. • Hirst, A.C., and J.S. Godfrey, 1993: The role of the ITF in as global ocean GCM. J. Phys. Oceanogr., 23, 1057–1086. • Hirst, A.C., and J.S. Godfrey, 1994: The response to a sudden change in the ITF in a global ocean GCM. J. Phys. Oceanogr., 24, 1895–1910. • Wajsowicz, R., 1995: The response of the Indo-Pacific throughflow to interannual variations in the Pacific wind stress. Part I: Idealized geometry and variations. J. Phys. Oceanogr., 25, 1805–1826. • Godfrey, J.S., 1996. The effects of the Indonesian Throughflow on ocean circulation and heat exchange with the atmosphere: a review. J. Geophys. Res., 101, 12217–12237.
Hirst and Godfrey (HG; 1993, 1994) addressed the near-surface flow in 2), and noted the propagation of baroclinic waves and their damping in 3). Wajsowicz (1995) contributed to 1), contrasting surface trapping in solutions to an idealized OGCM with and without Indonesian sills. 1) Why is most of the IT surface trapped in the upper 400 m, with indications of a second deep core? 2) Why does the near-surface flow in the IT come from the North Pacific, and the deep core from the South Pacific? 3) What processes account for remote impacts of the IT in the Indian and Pacific Oceans? 4) What processes transform the shallow, warm ITto deep, cool, South Pacific inflow, and vice versa? 5) What, then, is the impact of the IT on subthermocline circulations in the Pacific, particularly on the flow of thermostad water and AAIW?
Model overview LCS model, LOM, COCO Results Dynamics Basic processes Indonesian Seas IT vertical structure and source waters Indian Ocean SICC Pacific Ocean GBRUC, TJs, AAIW Summary
Model overview: A hierarchy of models
LCS model Linear, continuously stratified system with diffusion by vertical mixing Linearized about a state of rest with background density ρb(z) Solutions are expansions in barotropic and baroclinic modes (N = 25) Forced by ERA15 and HR winds in Indo-Pacific domain Solutions found with open and closed IT passages, and their difference illustrates the IT-associated circulation Integrations for 100 years The most important difference among the models is their parameterization of vertical mixing. LOM 4½-layer model with diffusion by transfer between layers where they are thin Layers 1–4 are surface, thermocline, thermostad waters, and AAIW. Forced by ERA15 winds in Indo-Pacific domain Solutions found with open and closed IT passages Integrations for 100 years Solutions with open passages, without open passages, and their difference are indicated by Q, Q’, and ΔQ, respectively. COCO Non-eddy-resolving GCM with a horizontal resolution of 1°×1° and 40 levels Forced by HR winds in Indo-Pacific domain Solutions found with open and closed IT passages Integrations for 80 years
Dynamics Basic processes How does the IT impact circulations in the IO and PO?
LCS: Δd, n = 1 mode The other baroclinic modes respond similarly, but are increasingly weakened by damping, which strengthens with n. Courtesy of Toru Miyama
n = 0 n = 1 n = 2 n = 3 LCS: Δd, n = 0–3 modes Barotropic flow confined to the perimeter of the southern IO and western boundaries of Australia and New Guinea. Damping of baroclinic Rossby waves by diffusion allows interior flows in both basins, with flows becoming weaker and more coastally confined as damping increases.
LCS: Δd, all modes The IT has a basin-wide impact on circulationsin both oceans. It is largest in the southern Indian Ocean and in the tropical Pacific. There are surface geostrophic currents flowing along lines of constant Δd. Because the baroclinic modes have no net transport, surface currents in the interior ocean are balanced by subsurface currents in the opposite direction.
LCS: Δd, all modes, IO There is a southeastward surface (northwestward subsurface) geostrophic flow across the interior of the South IO. They act to deepen the ITF transport, around the perimeter of the IO. There is anomalous downwelling (damping)caused by the ITF in the South IO wherever Δd is positive. This process is not physically correct. There is a circulation near the west coast of Australia similar to the Leeuwin Current system, with surface (subsurface) poleward (equatorward) flow? It is too weak, however, because, for realistic damping , the coastal signal is carried too far offshore by RWs (McCreary and Kundu, 1987). There is southeastward geostropic flow across the SIO, whereas the observed flow is eastward or northeastward.
LCS: IO transport profiles The baroclinic interior flow acts to deepen the circulation around the perimeter of the southern IO
LCS: Δd, all modes, PO There is a westward and equatorward surface (eastward and poleward) geostrophic flow across PO interior. They act to shallow the ITF transport as it flows northward along the east coast of Australia. These general structures of circulation, upwelling and downwellingare similar among all the models. But details of the baroclinic currents differ markedly because of different diffusion parameterizations. There is anomalous upwelling caused by the ITF in the Pacific wherever Δd is negative. This process is not physically correct.
LCS: PO transport profiles The interior flow in the South Pacific shallows the northward western boundary currents along the east coasts of Australia and New Guinea, eventually transforming them to the surface-trapped IT profile
Indonesian Seas Vertical structure How does the PO impact the IT?
LCS: ITF profiles Mean Nb, strong mixing Eq. Nb, strong mixing Eq. Nb, weak mixing Eq. Nb, 4th-order mixing Velocity profiles are sensitive to the strength of vertical diffusion (damping of baroclinic waves) and the background stratification. When diffusion is sufficiently weak, the ITF is surface trapped because the low-order baroclinic modes tend to cancel the barotropic response at depth. All of the profiles have a subsurface velocity minimum or reversal. As a result, the ITF has two cores. Why? Because of subsurface currents in the interior Pacific.
u(x,160˚E,z) LCS: u section, far-western Pacific Eastward currents north of about 2˚N (Halmahera) and centered near 200 m drain water from western Pacific, thereby weakening the IT at those depths. Draining by the shallower, stronger, eastward current (NECC) is balanced by flow from the NGCC or NEC, and so does not weaken the IT.
Indonesian Seas Source waters How does the PO impact the IT?
Ψ', closed The anticlockwise circulation within the Sulawesi Sea is part of the NP Tropical Gyre. It is present there because the latitude, y0, which divides the NP and SP Tropical Gyres (ψ' = 0), is near 2°N, south of the entrance to the Sulawesi Sea. Streamfunction ψ' is obtained with closed passages. It is the part of ψ that is driven by winds in the interior of the Pacific. Streamfunction Δψ is the part of ψcaused by the ITF. ΔΨ LCS: Hellerman winds Almost all of ψ comes from the northern hemisphere. Why? Ψ, open The two parts sum almost to cancel the flow in the southern part of the Sulawesi Sea, ensuring that the total transport comes from the north.
Ψ′, closed Latitude y0is now near 3.7°N, so that part of the SP Tropical Gyre is present in the Sulawesi Sea. ΔΨ Streamfunctionψ′no longer has a strong anticlockwise circulation in the Sulawesi Sea. So, it cannot cancel the westward current of Δψ north of Sulawesi. Why not? LCS: ERA15 winds Now, almost all of ψ comes from the southern hemisphere. Why? Ψ, open
QSCAT There is a region of strong negative curl south of the Philippines. It generates a shallow clockwise circulation in the Sulawesi Sea strong enough to eliminate the anticlockwise flow driven by winds in the interior Pacific. The region is absent in the QSCAT winds. It is also absent in the Hellerman winds. ERA15 and QSCAT winds ERA15
v(x,y,0), open v(x,y,-300 m), open Subsurface flow comes from the southern hemisphere, because transportψ′is weak at depth so that it is dominated by Δψ. LCS: Hellerman winds The surface flow all comes from the northern hemisphere, because transport of ψ′is concentrated near the surface and so dominates Δψ.
Ψ COCO: HR winds The total transport comes entirely from the north because the NGCC retroflects before it can penetrate into the Indonesian Seas, apparently because horizontal viscosity is so large and the inertial overshoot of the MC. hv1+2, open As in the LCS and LOM solutions, the shallow IT comes from the north and the deep flow comes from the south. hv4, open
Indian Ocean South Indian Countercurrent How does the IT impact the IO?
LCS: Δd There is no SICC jet-like flow, but rather a broad, southeastward flow across the basin.
LOM: Δd (CI = 0.05 cm) Surface geostrophic (baroclinic) currents extend southeastward across the SIO, with a richer meridional structure than in the LCS solution. The curved bands in the southern oceans result from a southward (northward) shift of the ACC in the IO (PO).
The South Indian Countercurrent extends across the basin along 25°S and flows to the southeast corner of the basin. LOM: SICC The circulation is more complex in LOM because vertical diffusion(across-layer transfer) occurs primarily where layer thicknesses become too thin (upwelling)or too thick (subduction). Δhv1+2
Subduction in the southeast IO and south of Australia drives the surface South Indian Countercurrent and a compensating subsurface westward flow along 25°S. LOM: SICC There is flow from the IO to the PO driven by eastward subsurface currents (Tsuchiya Jets) in the PO. Δhv3
Subduction and convective overturning in the southeast IO drives a surface South Indian Countercurrent along 25°S. COCO: Δd Surface geostrophic (baroclinic) currents extend southeastward across the southern IO, with richer meridional structure than in the LCS solution.
T There is an eastward countercurrentoverlying westward flow from 20−25°S. It extends from Madagascar to a region of convective overturning off Southwest Australia. It is much stronger when the Indonesian passages are open. COCO: SICC u, T, open u, T, closed
Pacific Ocean Great Barrier Reef Undercurrent How does the IT impact the South Pacific?
COCO: Δψ Barotropic flow field circulates around the southern IO and flows northward along the east Australian coast, with no significant currents in the interior of the Pacific
The observed SEC bifurcation shifts poleward with depth from about 16°S to 22°S. The deep northward flow within this latitude range is known as the Great Barrier Reef Undercurrent (GBRUC). A similar shift occurs in COCO but not in COCO´, a consequence of the strong northward flow along the Australian coast associated with the IT. This result suggests that the IT is the cause of the GBRUC. COCO: SEC bifurcation latitude v, obs. v, open v, closed
Pacific Ocean Tsuchiya Jets (layer 3) How does the IT impact the tropical Pacific?
With open IT passages, eastward currents in layer 3 extend from the western boundary to off-equatorial upwelling regions in the eastern ocean, the model’s Tsuchiya Jets (TJs). The IT drains enough water from layers 1 and 2 that upwelling extends into layer 3. LOM: Tsuchiya Jets hv3, open
With closed passages, the TJs are essentially eliminated. In this case, layers 1 and 2 are thicker, preventing much of the upwelling from extending to layer 3. In addition, the NGCUC reverses to flow southeastward to about 9˚S, so that southern-hemisphere water never reaches the equator. LOM: Tsuchiya Jets hv3, closed Based on a similar solution to a 4½-layer model, McCreary et al. (2002) concluded that the IT was necessary for the existence of the TJs, but …
With closed passages, the TJ is somewhat shallower with its core 1°C warmer, since less upper-ocean water is drained from the basin. Its strength is only slightly weakened, suggesting that the TJs are supplied primarily by an overturning cell within the Pacific basin. COCO: Tsuchiya Jets u, T, open u, T, closed 1oC warmer
Pacific Ocean AAIW (layer 4) How does the IT impact the North Pacific?
Δhv4 hv4, open The transport of the NGCUC in layer 4 (AAIW) is 3.5 SV. Of this amount, 2.7 Sv flows directly out of the Pacific into the Indian Ocean. The remaining 0.8 Sv flows into the far North Pacific. Its path through the tropics is not clear. It enters the subpolar ocean through a “baroclinic window” (Pedlosky, 1984), and upwells into the shallower layers there via Ekman suction. With closed passages, no AAIW flows into the northern hemisphere, indicating that the IT is the cause of this flow. The difference field misrepresents pathways by which water actually flows into the North Pacific. It flows through the tropics by a circuitous route, due to deep, eddy-driven circulations associated with the Hawaii Lee Countercurrent. The window circulation is reversed by the Pacific’s wind-driven, double-gyre (STC and SPG). So, water enters the subpolar ocean along the boundary between the gyres. LOM: Flow of AAIW into NP Δhv4
Δhv4 hv4, open The NGCUC transport in layer 4 (AAIW) is 2.5 SV. Of this amount, 1.3 Sv flows directly into the Indian Ocean. The remaining 1.2 Sv flows into the North Pacific. It flows northward in a western-boundary current, and circulates about a deep part of the NP Subtropical Gyre. As in Solution ΔLOM, it then enters the subpolar ocean through a “baroclinic window,” eventually upwelling into the shallower layers there. As for LOM, with closed passages no AAIW flows into the northern hemisphere, indicating that the IT is the cause of this flow. The difference field misrepresents pathways by which water actually flows into the North Pacific. It again flows through the tropics by a circuitous route, first flowing eastward near 7°N and then westward in the STG. The window circulation is reversed by the Pacific’s wind-driven, double-gyre (STC and SPG). So, water enters the subpolar ocean along the gyre boundaries or near the eastern boundary. COCO: Flow of AAIW into NP
In the interiors of the Pacific and Indian Oceans, circulations associated with the IT are generated by the radiation and decay of baroclinic waves. As a consequence, subsurface currents are directed opposite to their surface counterparts. Details of the circulations are sensitive to the nature of diapycnal mixing. • The IT is split into near-surface and deep cores by baroclinic currents generated in the interior Pacific (EUC and TJs). ITF source waters come from the north (south) in the shallow (deep) core, the former due to the near-surface circulation driven by Pacific winds or to inertial overshoot. • The SICC is generated by subduction and/or convection near Southwest Australia. The ITF strengthens the SICC considerably. • The IT enhances northward flow along the east coast of Australia, generating the GBRUC. • The IT provides all (LOM) or some (GCMs) of the thermostad waterthat flows across the Pacific in the TJs to upwell in the eastern ocean. • The IT is the reason why AAIW flows into the North Pacific, eventually to upwell in the Subpolar Gyre.
LOM: Δh1+2 (CI = 10 m) The thermocline depth (h1 + h2) deepens by more than 100 m off the west coast of Australia.
Δd Surface geostrophic (baroclinic) currents extend westward and equatorward across the PO… …particularly in the South Pacific from 20S o 5S.
The transport of the NGCUC in layer 4 (AAIW) is 3.5 SV. Of this amount, 2.7 Sv flows directly out of the Pacific into the Indian Ocean. The remaining 0.8 Sv flows into the far North Pacific. Its path through the tropics is not clear. It enters the subpolar ocean through a “baroclinic window” (Pedlosky, 1984), and upwells into the shallower layers there via Ekman suction. With closed passages, no AAIW flows into the northern hemisphere, indicating that the IT is the cause of this flow. LOM: Flow of AAIW into NP Δhv4