Download
1 / 28
280 likes | 419 Views
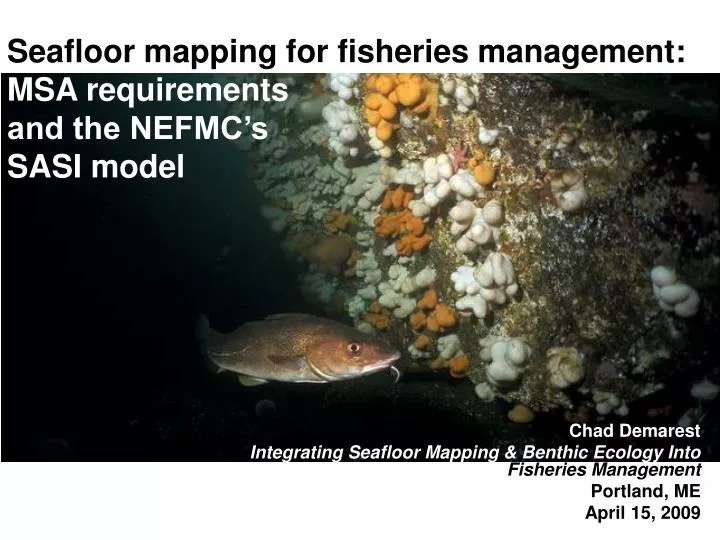
Seafloor mapping for fisheries management: MSA requirements and the NEFMC’s SASI model. Chad Demarest Integrating Seafloor Mapping & Benthic Ecology Into Fisheries Management Portland, ME April 15, 2009. Objective.

E N D
Seafloor mapping for fisheries management: MSA requirementsand the NEFMC’s SASI model Chad Demarest Integrating Seafloor Mapping & Benthic Ecology Into Fisheries Management Portland, ME April 15, 2009
Objective Describe the NEFMC’s use of seafloor maps and benthic ecology in meeting the MSA’s requirements to minimize to the extent practicable the adverse effects of fishing on EFH
The MSA requires FMP’s to: • Describe and identify essential fish habitat (EFH) for every fishery • Minimize to the extent practicable the adverse impacts of fishing on EFH • List the major prey species for the species in the FMU and discuss their location • Identify non-fishing activities that may adversely affect EFH
What is EFH? “The term ‘essential fish habitat’ means those waters and substrate necessary to fish for spawning, breeding, feeding or growth to maturity.” MSA, 2006
The Final Rule “Adverse effect means any impact that reduces quality and/or quantity of EFH” “Councils must act to prevent, mitigate, or minimize any adverse effects from fishing, to the extent practicable, if there is evidence that a fishing activity adversely affects EFH in a manner that is more than minimal and not temporary in nature.”
More Guidelines “Loss of prey may be an adverse effect on EFH… Therefore, actions that reduce the availability of a major prey species, either through direct harm or capture, or through adverse impacts to the prey species’ habitat that are known to cause a reduction in the population of the prey species, may be considered adverse effects on EFH if such actions reduce the quality of EFH”
And yet more Guidelines “Adverse effects may include direct or indirect physical, chemical, or biological alterations of the waters or substrate and loss of, or injury to, benthic organisms, prey species and their habitat, and other ecosystem components, if such modifications reduce the quality and/or quantity of EFH.” “Adverse effects to EFH may result from actions occurring within EFH or outside of EFH and may include site specific or habitat-wide impacts, including individual, cumulative, or synergistic consequences of actions.”
NEFMC Objectives • Identify all major fishing threats to the EFH of those species managed by the Council • Identify and implement mechanisms to protect, conserve, and enhance the EFH of those species managed by the Council to the extent practicable. • Define measurable thresholds for achieving the requirements to minimize adverse impacts to the extent practicable • Integrate and optimize measures to minimize the adverse impacts to EFH across all Council managed FMPs
Model components • Tow distance • Effective linear gear width • Gear component contact index • Gear component sensitivity index
Tow distance and gear widths are modeled for nine primary gear types based on empirical data (observer, VTR, VMS) • Contact indices are categorically defined • Sensitivity indices are calculated as a function of habitat and gear-specific susceptibility and recovery values
Sensitivity indices Sensitivity is defined here as a combination of the effects of a fishing gear on the functional value provided by a unit of habitat (Susceptibility), and the recovery in functional value that unit of habitat will experience after the gear effect has passed (Recovery) Sensitivity =ƒ (Susceptibility, Recovery) where Susceptibility and Recovery are known to vary across: • Habitats • Energy environments • Fishing gears
Habitats Consistent with literature review of fishing gear impacts Substrate as primary impact surface Inferred ‘features’ consistent with underlying substrates • Energy environments Classified high or low based on: • critical shear stress model • depth • Fishing gears Gear types and area swept based on spatially-delineated commercial fisheries data
Assessment matrices • All cells assessed (hypothetical interactions) • Susceptibility independent of energy, but recovery not
Mapping habitats for SASI Data sources: • usSEABED (extracted and parsed) • SMAST video survey • NOAA trawl survey hangs (codes 5 & 9)
Vorinoi tessellations allow the size of the unit area to vary in proportion to the density of data available, producing irregular shaped polygons of varying sizes Unstructured grid
Energy environments Environments with different energy characteristics are created by the flow of water over habitats These energy environments affect the: • nature of fishing gear impacts (i.e. loss of functional value) • susceptibility of habitats to fishing gears • habitat recovery rates
Applying the SASI model spatially The model represents a quality-adjusted area of seabed impacted by NE gears per spatial unit (e.g. tms, 5k grid) The Sensitivity Index (e.g., So, Sc, Ss) is derived from matrices specific to a combination of gear type / habitat / energy; they apply uniformly across gear components
End products • Matrices summarizing the hypothetical sensitivity of habitat components to fishing gears • Maps depicting the realized vulnerability of habitat area units to fishing gears, as measured by quality-adjusted m2 and summed across all gears fishing in each area • Assessment of adverse effects based on pre-determined thresholds
Alternative impacts analysis Matrices and SASI allow PDT to quantify and visualize changes in quality-adjusted seabed impacts, enabling analysis of: • Area-based fishing restrictions (mapping hypothetical or re-directed fishing effort) • Gear modifications (changing SASI contact and sensitivity indices)