Download
1 / 38
380 likes | 451 Views
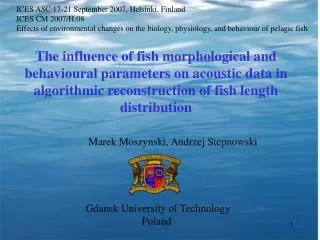
THE ESTIMATI O N OF FISH LENGTH DISTRIBUTION FROM ITS ACOUSTIC ESTIMATES USING DUAL FREQUENCY APPROACH. M. Moszynski and A.Stepnowski. Gdansk University of Technology Poland. ON THE POSSIBILITY OF ESTIMATING FISH LENGTH DISTRIBUTION FROM ITS TARGET STRENGTH STATISTICS. Summary

E N D
THE ESTIMATION OF FISH LENGTH DISTRIBUTION FROM ITS ACOUSTIC ESTIMATES USING DUAL FREQUENCY APPROACH • M. Moszynski and A.Stepnowski Gdansk University of Technology Poland
ON THE POSSIBILITY OF ESTIMATING FISH LENGTH DISTRIBUTION FROM ITS TARGET STRENGTH STATISTICS Summary In the paper the problem of estimating of fish length PDF from its target strength PDF obtained from acoustic surveys is considered. As it was shown, the target strength of a single fish can be treated in the first approximation as a function of two variables: one, which depends on fish size and the other, which depends on its angular orientation (aspect). • Outline • Fish backscatter models • Tilt angle dependance • Inverse processing • Simulations • Data survey analysis
Introduction (1) • Fish biomass estimation in fishery acoustics for operating frequency f : Ei = SL+RS + TSi(li, i , zi )+ 2B(i ) - TVG( Ri, α) TS = 10log BS= 20log lBS < BS > Q – biomass estimation
INVERSE PROCESSING pl • Backscattering model • Tilt angle statistics Biomass Q pTS MEAN VALUE PROCESSING < l > • Sample catch • Regression relation Introduction (2)
Simple backscatter model for swimbladdered fish • Haslett, 1962 • swimbladder is approximated by a combination of: • a hemisphere, • a short cylinder, • a cone of fixed dimensions relative to the fish fork length. • then this shape is modified to: • a cylinder maintaining their geometrical cross section.
Backscatter theory (1) +0 k aecb lecb
Kirchhoff-ray mode Backscatter Model (KRM) • Clay and Horne, 1994 • fish body as a contiguous set of fluid-filled cylinders that surround a set of gas-filled cylinders representing the swimbladder Sockeye salmon (Oncorhynchus nerka) Lateral radiograph: Dorsal radiograph:
Mean Target Strength <TS> • Reduced scattering length – RSL • TS = 20 log L + 20 log (RSL) • regression relationship for average target strength • ( according to the National Marine Fisheries Service): • use lecb = L/4 as in Haslett model for estimate of <lecb> • example - fish fork length: L = 31.5 cm • - from theoretical equation: • TS0( f = 38kHz) = -32dB TS0( f =120kHz) = -27dB • - from regression: • <TS>= -36dB
Tilt angle dependance (1) f = 38kHz 0=8° lecb=L/4
Tilt angle dependance (2) f = 120kHz 0=8° lecb=L/4
Tilt angle dependance (3) Target strengths as a function of tilt angle for a 31.5cm pollock at dorsal aspect at 38kHz and 120kHz Foote (1985) Walleye pollock Theragra chalcogramma (Horne - Radiograph Gallery)
Tilt angle dependance (4) TS/length relationship on tilt angle for atlantic codTS = 20log L + B20, McQuinn, Winger (2002)EK500 38kHz SB 7 Atlantic cod Gadus morhua (Horne - Radiograph Gallery) B20
fish size and orientation generator pTS L TS0 TS pTS0 pL Simulation Random generation Statistical processing backscatter model backscatter model inversion backscatter model
Simulation • Fish size and orientation - assumptions: • backscattering length of fish school between 30cm and 60cm normally distributed • random distribution of fish orientation in consecutive fish echoes • trace of the fish • - straight line, • fish tilt angle • - normal distribution • 8° as mean value • for swimbladder tilt angle
Method 2 - Conditional fish beam pattern PDF TS0 [dB] Bf [dB]
Method 2 - Conditional fish beam pattern PDF TS0 [dB] Bf [dB]
Method 2 - Inverse processing (4) [dB] [m]
Survey data (1) • NOAA/Alaska Fisheries Science Center - summer 2002 -Bering Sea • provided by Neal Williamson (PMEL - Seattle)
Survey data (2) • Simrad EK500 v.5.30 echosounder • 38kHz split beam transducer • logged w/ Sonardata's Echolog 500 • 14-07-2002 8:57 – 11:22 am • 6776 pings (540MB) • 2002 tracks of walleye pollock • (Theragrachalcogramma)
Survey data analysis (1) [dB] [cm]
Survey data analysis (2) [dB] [cm]
Survey data analysis (5) Reconstruction of fish length PDF for different mean swimbladder tilt angle 0 along with estimate from catch data. Upper sequence for 38kHz and lower for 120kHz. X-axis represents fish length in [cm].
Survey data analysis (5) Root mean square error function obtained from 38kHz and 120 kHz estimates
Survey data analysis (6) Estimates of length PDF for mean swimbladder tilt angle 0=7 along with catch data
Acknowledgements • The authors would like to thank: • Neil Williamson and • John Horne • for providing sample data files collected by Alaska Fisheries Science Center (NOAA) during summer 2002 survey