Download
1 / 28
280 likes | 291 Views
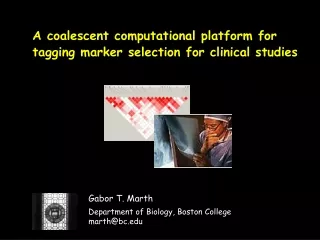
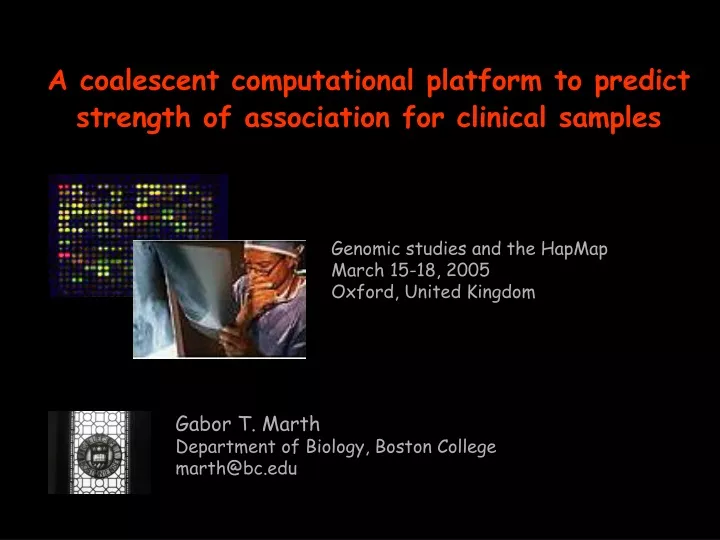
A coalescent computational platform to predict strength of association for clinical samples. Genomic studies and the HapMap March 15-18, 2005 Oxford, United Kingdom. Gabor T. Marth. Department of Biology, Boston College marth@bc.edu. 2. compute strength of association.

E N D
A coalescent computational platform to predict strength of association for clinical samples Genomic studies and the HapMap March 15-18, 2005 Oxford, United Kingdom Gabor T. Marth Department of Biology, Boston College marth@bc.edu
2. compute strength of association 3. select a smaller set of markers that capture most of the information present in the complete set of markers Using the HapMap 1. genotype a set of reference samples 4. use these markers in clinical studies
CEPH European samples Yoruban samples Allele structure varies among populations
… and within a single population (random 60-chromosome subsets of 120 CEPH chromosomes from 60 independent individuals)
Markers selected based on the allele structure of the HapMap reference samples… … may not work well in another set of samples such as those used for a clinical study. Possible negative consequences
2. Experimentally genotype additional sets of samples, and compare association structure across consecutive sets directly HapMap reference samples How to assess sample-to-sample variability? 1. Understanding fundamental characteristics of a given genome region, e.g. estimating local recombination rate from the data McVean et al. Science 2004 3. It would be highly desirable to generate such additional sets with computational means
2. select markers with standard methods 1. generate computational samples 3. test markers across consecutive sets of computational samples Towards a marker selection tool Reference samples
3. Use the second haplotype set induced by the same mutations as our computational samples 2. Enforce data-relevance by requiring that the first set reproduces the observed haplotype structure of the HapMap reference samples. Calculate the data likelihood (the probability that the genealogy produces the observed haplotypes). HapMap reference samples Generating additional computational haplotypes 1. Draw pairs of haplotype sets with Coalescent genealogies 4. In subsequent statistics, weight each such set proportional to the data likelihood calculated in 2.
Generating computational samples M Problem: The efficiency of generating data-relevant genealogies (and therefore additional sample sets) with standard Coalescent tools is very low even for modest sample size (N) and number of markers (M). Despite serious efforts with various approaches (e.g. importance sampling) efficient generation of such genealogies is an unsolved problem. N We propose a method to generate “approximative” M-marker haplotypes by composing consecutive, overlapping sets of data-relevant K-site haplotypes (for K small enough)
2. build M-site composites Approximating M-site haplotypes as composites of overlapping K-site haplotypes 1. generate K-site sets
Generating K-site haplotypes K=3,4 reference data 1 match / 100 – 10,000 Coalescent genealogies
000 100 001 101 010 110 011 111 000 001 010 011 100 101 110 111 Piecing together neighbor K-site haplotypes 1 matching pair in 1,000 – 20,000 pairs
Building composite haplotypes Pr(composite) = Pr(K-site1) Pr(K-site1 ~ K-site2)Pr(K-site2) Pr(K-site2 ~ K-site3)Pr(K-site3) (rooted in composite likelihood approaches to recombination rate estimation e.g. by Hudson, Clark, Wall)
Pr(composite) = Pr(K-site1)Pr(K-site1 ~ K-site2)Pr(K-site2)Pr(K-site2 ~ K-site3)Pr(K-site3) Data probability for composite haplotypes (motivation from composite likelihood methods for recombination rate estimation e.g. by Hudson, Clark, Wall)
Example: CFTR gene Hinds et al. Science, 2005
3-site approximation (example) 3-site composite haplotypes LD structure in the CFTR gene, in 30 CEPH HapMap reference individuals, at common marker positions (data)
4-site composite #1 4-site composite #2 4-site composite haplotypes HapMap data
“short-range” “long-range” Quality of the composite approximation the “best-case” 3-site scenario: composite of exact 3-site sub-haplotypes
Quality: 4 sites Composite of exact 4-site sub-haplotypes
Variance across sets data set #1 data set #2 data set #4 data set #3
Example: 4-site approximation 4-site composite #2 4-site composite #1 4-site composite #4 4-site composite #3
Technical/algorithmic improvements 1. matching un-phased genotypes 2. dealing with markers with unknown ancestral state 3. dealing with uninformative markers 4. composites of non-sequential K-site haplotype sets 5. demographic model parameters for Coalescent 6. accounting for local recombination rate
Software engineering aspects: efficiency • Currently, we run fresh Coalescent simulations at each K-site (several hours per region) • Total # genotyped SNP < 10 million. This is the upper limit of different haplotype (or diploid genotype) counts. It is possible to pre-compute computational sets. 4 populations x 10 million K-sites x 1,000 comp sets x 50 bytes < 2 terabytes
Acknowledgements Eric Tsung Aaron Quinlan Ike Unsal Eva Czabarka (Dept. Mathematics, William & Mary)