Download
1 / 32
320 likes | 327 Views
Explore the data and tools to visualize the changes happening in the Arctic climate, including sea ice extent, glacier melting, permafrost thawing, and the impact on wildlife and global climate.

E N D
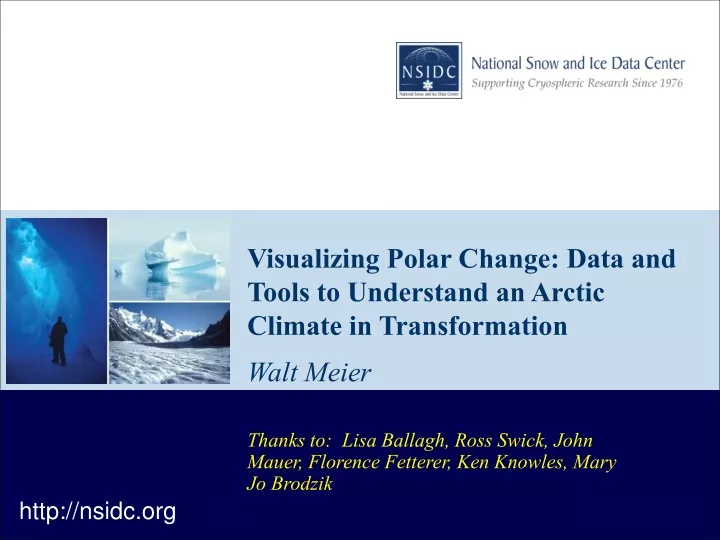
Visualizing Polar Change: Data and Tools to Understand an Arctic Climate in Transformation Walt Meier Thanks to: Lisa Ballagh, Ross Swick, John Mauer, Florence Fetterer, Ken Knowles, Mary Jo Brodzik http://nsidc.org
U.S.S. Jeannette Expedition, 1879-1881 U.S. Naval Historical Center, http://www.history.navy.mil/ Visualizing Polar Change
That was then… This is now Little hope that Jeannette would get within 2000 km of North Pole Jeannette could’ve made it to within 500 km of North Pole before encountering almost any ice NSIDC on GoogleEarth http://nsidc.org/data/virtual_globes/ Visualizing Polar Change
The Cryosphere – The World of Ice and Snow Snow, sea ice, glaciers, ice sheets, frozen ground Spans 90°S 0° 90°N Affects over 100 countries Atlas of the Cryosphere, http://nsidc.org/data/atlas/ Visualizing Polar Change
Sea Ice Extent Varies through the Year Adapted from the Sea Ice Index http://nsidc.org/data/seaice_index/ Mar = 15,000,000 km2 Sep = 7,000,000 km2 Mar = 4,000,000 km2 Sep = 19,000,000 km2 Visualizing Polar Change
Sea Ice Varies from Year to Year 1979-2000 Median September Monthly Sea Ice, 1979 – 2007 NASA Blue Marble. Thanks to M. Savoie Visualizing Polar Change
Summer Sea Ice is Rapidly Decreasing Data from NSIDC Sea Ice Index http://nsidc.org/data/seaice_index/ 1979 – 2000 Avg. = 7.0 million km2 Trend = -10.2% per decade 2007 = 4.3 million km2 Visualizing Polar Change
How Much Sea Ice Loss are We Talking About? 1980: 7.85 million sq km 2005: 5.57 million sq km 2007: 4.28 million sq km September Monthly Average Sea Ice Extent from the Sea Ice Index Image by D. Perovich, Cold Regions Res. Eng. Lab Visualizing Polar Change
Climate Models are Underestimating Speed of Changes Range of Models Observations 2007 = 4.28 From Stroeve et al., 2007 Observations vs. IPCC model simulations for month of September Visualizing Polar Change
Impacts of an Arctic without Summer Sea Ice Photo by Mike Webber, U.S. Fish & Wildlife Service Visualizing Polar Change
Sea Ice – Albedo Feedback Temperature Ice melt Amplification of warming Heat Albedo Energy absorption Visualizing Polar Change
Albedo – How Much Solar Energy Gets Absorbed With sea ice: <40% absorbed Without sea ice: >90% absorbed The change from sea ice to ice-free ocean is the largest surface contrast on earth as far as solar energy is concerned 200+ W/m2 difference for a clear mid-summer day Up to 100X direct CO2 forcing locally Visualizing Polar Change
Loss of Sea Ice Will Impact Climate Globally Precipitation decrease without Arctic sea ice during the summer Alaska CO Sewall and Sloan, Disappearing Arctic sea ice reduces available water in the American west, Geophysical Research Letters, 2004. Visualizing Polar Change
Impacts of Arctic Sea Ice Loss • Polar bears rely on sea ice to hunt for food - 2/3 reduction in polar bear population within 50 years (USGS) • Other wildlife – walrus, seals, birds, fish – also will be impacted significantly • Inuit communities rely on ice for transportation, hunting; indelible part of native cultures in the north • Lack of ice coastal erosion is a substantial threat to buildings and towns Photo by Craig George • Some positive benefits – commerce, e.g. through Northwest Passage • Natural resources (oil, gas, minerals) • Possible conflicts over national sovereignty – who “owns” the Arctic? Visualizing Polar Change
GreenlandThe 800-Pound Gorilla of Arctic Climate Change Visualizing Polar Change
Greenland is Melting and Losing Mass Greenland Mass Balance NASA Earth Observatory, from GRACE satellite 2007 Greenland Melt NSIDC, W. Abdalati (NASA) Visualizing Polar Change
Jakobshavn Isbrae • World’s fastest flowing glacier, ~20 m per day • Speed has doubled in recent years • Edge of glacier has retreated dramatically since 1997 • Many Greenland outlet glaciers are accelerating, thinning, and termini retreating Landsat imagery, NASA Visualizing Polar Change
Greenland ice equivalent to ~20 feet sea level rise Visualizing Polar Change
Glaciers are Receding Worldwide 1941 William O. Field Bruce Molnia, USGS 2004 Muir Glacier, Alaska Visualizing Polar Change
Glaciers are Receding Worldwide Muir Glacier Alaska NSIDC Glacier Pairs Photo Archive Visualizing Polar Change
Global Land Ice Measurements from Space (GLIMS) Glacier outlines and imagery Research-level data http://nsidc.org/glims Visualizing Polar Change
Permafrost is Thawing Alaska Thawing permafrost will not only affect infrastructure. There are massive amounts of GHG locked in the frozen ground that could be released if the permafrost thaws. Chersky, Russia Alaska Qinghai-Xizang Highway bridge collapse Visualizing Polar Change
Snow Cover is Variable, Little Overall Trend 10 Feb 2008 5-11 Feb 2007 NOAA IMS Daily Snow Cover http://nsidc.org/data/g02156.html Weekly Snow and Ice Cover http://nsidc.org/data/nsidc-0046.html Visualizing Polar Change
Snow is Melting Earlier in Spring From IPCC AR4 Earlier snow melt has impacts on water resources – reservoir replenishment Visualizing Polar Change
AntarcticaThe Sleeping Giant of Climate Change Mosaic of Antarctica http://nsidc.org/data/moa/ Visualizing Polar Change
Larsen-B: The First Victim of Global Warming? • Ice shelf the size of Rhode Island collapsed in weeks • First time area free of ice in ~12,000 years • Glaciers behind ice shelf have accelerated significantly sea level rise NASA/NSIDC 31 January – 7 March 2002 Atlas of the Cryosphere Visualizing Polar Change
Whither Arctic Sea Ice?Using Sea Ice Data in the Classroom AccessData Earth Exploration Toolbook chapter http://serc.carleton.edu/eet/seaice/ Developed by: Walt Meier National Snow and Ice Data Center, Univ. Colorado Coop. Inst. for Research in Environmental Sciences Betsy Youngman Phoenix Country Day School Mark McCaffrey Coop. Inst. for Research in Environmental Sciences Anupma Prakash Geophysical Institute, University of Alaska Fairbanks Brian Rogan Boston Museum of Science Visualizing Polar Change
Whither Arctic Sea Ice?Using Sea Ice Data in the Classroom • Use satellite data of sea ice to analyze trends and variability, 1979 - present • Case studies for various regions • Impacts on people/wildlife • Hudson Bay developed, others possible • Imagery and animations for qualitative analysis • Quantitative data for more involved analysis • Uses ImageJ (freeware) for data/image analysis and processing • MS Excel or other spreadsheet for further data analysis • Data from NSIDC via ftp Visualizing Polar Change
Going Further – Hudson Bay Case Study • Timing of when ice leaves Hudson Bay and when it returns • Examine trends and variability • How might trends affect polar bears in future? • Other case studies on different regions, asking different questions can be developed Visualizing Polar Change
Northwest Passage – That Was Then After 400 years of trying, Roald Amundsen successfully navigated the NW Passage in 1906 It took him and his crew nearly 3 years Visualizing Polar Change
Northwest Passage – This Is Now 21 Aug 2007 In 2007, a 57-foot sailboat navigated the passage in a few weeks Amundsen’s Route From Univ. of Bremen Visualizing Polar Change
NSIDC Visualization Data and Tools • NSIDC on GoogleEarth • http://nsidc.org/data/virtual_globes/ • Atlas of the Cryosphere • http://nsidc.org/data/atlas/ • Sea Ice Index • nsidc.org/data/seaice_index/ • Mosaic of Antarctica • http://nsidc.org/data/moa/ • GLIMS • http://nsidc.org/glims/ • Glacier Photographs • http://nsidc.org/data/g00472.html • Weekly Snow Cover Climatology • http://nsidc.org/data/nsidc-0046.html • Daily Snow Cover • http://www.ssd.noaa.gov/PS/SNOW/ • Other Cryospheric Information • http://nsidc.org/cryosphere/ • Whither Arctic Sea Ice? EET Chapter • http://serc.carleton.edu/eet/seaice/ walt@nsidc.org Funding and Support from Visualizing Polar Change