Download

1 / 37
370 likes | 380 Views
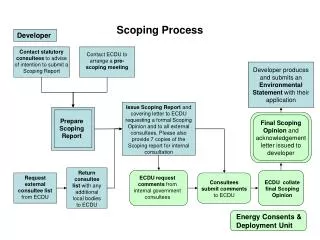
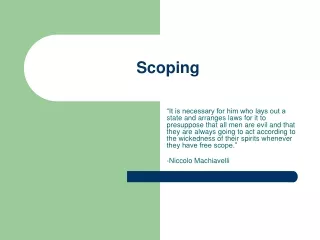
Scoping. Creation of logic model Specify how policy and infrastructure changes will eventually impact health outcomes Helps in focusing the impact assessment Quantitative Qualitative. Logic Model. Policy Proximal Intermediate Health Impacts Impacts Outcomes.

E N D
Scoping • Creation of logic model • Specify how policy and infrastructure changes will eventually impact health outcomes • Helps in focusing the impact assessment • Quantitative • Qualitative
Logic Model Policy Proximal Intermediate Health Impacts Impacts Outcomes Build sidewalks and crosswalks Air and noise pollution Lung disease Safety Mortality Traffic Change 60 ft. easement to 40 ft. (thin wall arcade, buildings built closer to sidewalk, Oreo deck) Physical activity Obesity connectivity Social capital CVD Parking requirements Cancer Injuries and fatalities Diabetes Land-use Permit mixed-use zoning floor/area ratio dwelling units pop. density Depression, anxiety, stress People outside I-85 traffic Hypertension Pop. density Osteoporosis parking Bus ridership Injury
Risk Assessment • Qualitative • Traffic • Pollution • Social capital • Crime and safety • Economic development • Gentrification • Quantitative • Injury • Physical Activity
Determining Affected Population • The individuals who live in the study area (N. Druid Hills to Clairmont) • 5 census blocks • Only counted those that lived ½ mile from highway • 14,000 people • Individuals who drive through study area • ADT (23,034) x people per car (1.63) • 37,545 people • No demographic data available
Demographics for Study Area Study Area Atlanta % Male 60.0 49.4 Age 0-17 18.9 26.6 18-29 28.3 18.1 30-39 23.3 18.4 40-49 10.9 15.7 50+ 8.6 21.2
Demographics for Study Area Study Area Atlanta Race White 47.3 63.0 Black 20.8 28.8 Asian 4.8 3.3 Ethnicity Hispanic 49.8 6.5
Demographics for Study Area Study Area Atlanta Foreign-born 61.1 10.3 Non-resident 1995 26.6 4.1 Poverty 15.8 9.2 Avg. income $45,511 $51,948
Household Demographics • Average family size is 3.4 • Most families (70%) have 2 or more workers • 12% of households have no car and 48% have 1 car • 17% take transit to work and 3% walk
Pedestrian Data for All Crashes in DeKalb County, GA • 67% of pedestrians hit were males • 77% of pedestrian fatalities were males • Of the 62 fatally injured pedestrians: • 47% Black • 36% Hispanic • 17% White DeKalb Board of Health (2003)
Severity of Injuries in DeKalb on Buford Highway Severity N % Fatalities 12 16.2 Serious Injuries 17 23.0 Visible Injuries 29 39.2 Complaints of Injuries 12 16.2 No Injuries 4 5.4 * DeKalb Board of Health
Number of Injuries and Deaths on Buford Highway DeKalb Study Area (8 miles) (2.37 miles) Injuries/year 18.6 6.7 Deaths/year 3.6 1.8 DeKalb Board of Health (2003)
Estimating Changes in Injury • No studies could be located to determine injury reduction based on proposed changes • Hired senior traffic engineers (Hamilton & Associates) to calculate expected changes
Estimating Crash Reduction CRFt = CRF1 + (CRF2 ) (1-CRF1) + … (CRFn) (1-CRF1) (1 – CRF2)…(1-CRFn-1) • Where CRFt = CRF of combined measures • CRF1 = CRF for the first countermeasure • CRF2 = CRF found the second countermeasure • CRFn = CRF for the nth countermeasure
Collision Reduction Factors Hamilton & Associates (2004) *ranges represent upper and lower bound estimates from studies
Injuries and Fatalities: Study Area Current Expected After Reduction Pedestrian Injuries/Year6.7 .91 (.89- .94) 0.4 Pedestrian Deaths/Year1.8 .91 (.89- .94) 0.1 Automobile Injuries/Year120 .60 (.39 -.65) 46
Physical Activity • Hard to find study that had good measures of physical activity and the built environment – we chose study with best measure of physical activity • Saelens et al. (2003) found a 72.5 minute difference in total walking per week between neighborhoods in San Diego • Saelens et al. (2004) found 124 minute difference in walking for transport In low-income neighborhoods in Seattle
Walkability Audit Results Neighborhood Score Grade San Diego High Walkable 1.4 A- San Diego Low Walkable 2.0B Buford Before 4.1D Buford After 2.4B- 1=A to 6=F
Estimating Increases in Walking • Since there were only 2 data points to serve as the source for the effect parameter there is uncertainty with respect to the shape of the relationship • Linear increase (204 minute increase/week) • Dichotomous function (76.2 minute increase/week) • Curvilinear relationship (11 minute increase/week) • No effect
Buford Highway Post-Project – Seattle Estimate = 200 mins/week
Qualitative Analysis • Traffic • Probably decrease along Buford Highway with increases along other Atlanta Highways • Noise Pollution • Increase during construction then decrease afterwards due to slower and less traffic • Air Pollution • Small decreases in local area but not significant enough to affect entire Atlanta area
Qualitative Analysis • Social capital • Increase in social capital due to increased walkability and greenspace • Crime and safety • Literature to mixed to make any predictions on direction • Economic development and Gentrification • Due to central location inside Atlanta next to exclusive neighborhoods economic development as well as gentrification are likely
Assumptions for Estimating PA • Their were several limitations in the Saelens et al (2003) study which may affect the expected increases in pa predicted in this HIA • Walkability and not other factors explain the differences found in the Saelens et al (2003) study • The built environment aspects that were correlated with differences in pa in the San Diego neighborhoods will have the same effect along Buford Highway
Assumptions for Estimating PA • The Ft. Collins LOS instrument was able to capture the elements of the built environment related to physical activity • Increases in walking that are predicted represent increases in total pa and not a substitution • The relationship between the built environment and pa is not only correlational but causal • For the CEA analysis it was assumed that the walking bouts will be at least 10 minutes in length so that they will have health impacts
Assumptions for Estimating Injury • Traffic calming measures used in other parts of the county will have the same effect along Buford Highway • The effects of the crash reduction factors are additive • The best available estimates for CRFs were used, which included personal communication with local DOTs, and the predictive certainty of most of the CRFs are unknown
Assumptions for Estimating Injury • Traffic may be diverted onto other streets and there may be a change in injuries along those streets • The residents will use the medians and crosswalks • For the CEA It was assumed that the same number of people will be driving and walking along Buford Highway despite the projected increases in population
Evaluation of Impact • Sections of Buford Highway (Shallowford to I-285) will be redeveloped starting in the spring of 2005 • Changes will not be as extensive as those proposed by Georgia Tech • Decision made before HIA was completed • Discussing placing full medians with sidewalks in the southern section of Buford Highway
Key Challenges of HIA • Uncertainties (data, models, policy) • Timeliness • Relevance to stakeholders and decision makers • Political context • Importance relevant to other factors • Capacity to conduct HIAs
Next Steps for HIA • Adapting HIA to the unique policy-making environment of the U.S. • Moving from research to practice • Methods to sort through bills/initiatives to find those for which HIA is most suitable • Standardizing and streamlining impact estimation • Determine feasibility of different types of tools in various settings • Training
Summary • HIA is a new and evolving science in the U.S., however it is a promising new approach to quantify health impacts of a wide variety of policies and projects • HIA provides only one piece of information (health) in complex decisions and stakeholders may have different priorities • HIA provides an outlet for health to be appropriately factored into complex decisions