Download
1 / 45
450 likes | 566 Views
Longer Blades and Floating Structures; Key Technology Innovations to Drive Down UK Offshore Wind Cost of Energy. All Energy, Aberdeen 23 May 2013. Who is the ETI?. The Energy Technologies Institute (ETI) is a public-private partnership between global industries and UK Government

E N D
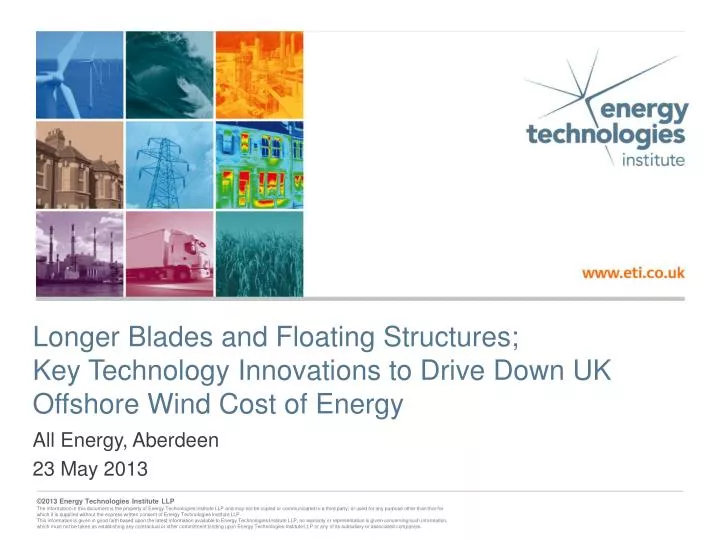
Longer Blades and Floating Structures; Key Technology Innovations to Drive Down UK Offshore Wind Cost of Energy All Energy, Aberdeen 23 May 2013
Who is the ETI? • The Energy Technologies Institute (ETI) is a public-private partnership between global industries and UK Government • Safeguarding affordable and secure future energy mix • Delivering proof of concept for new energy technologies • Our projects impact economic development
£208m major projects underway£162m further projects in development Commissioning and funding projects Organisations working with the ETI
The Low Carbon Energy 2050 “opening team” • Demand management
The Low Carbon Energy 2050 “opening team” • Demand management • Nuclear
The Low Carbon Energy 2050 “opening team” • Demand management • Nuclear • Fossil fuel, with carbon capture and storage • Including gas
The Low Carbon Energy 2050 “opening team” • Demand management • Nuclear • Fossil fuel, with carbon capture and storage • Including gas • Biomass, with carbon capture and storage
The Low Carbon Energy 2050 “opening team” • Demand management • Nuclear • Fossil fuel, with carbon capture and storage • Including gas • Biomass, with carbon capture and storage Provided all technology options are available
The super-sub! • Offshore Wind is the main hedging option for 2050 UK energy mix • The Offshore Wind super-sub plays an important role: not just on the bench.
The super-sub! • Offshore Wind is the main hedging option for 2050 UK energy mix • The Offshore Wind super-sub plays an important role: not just on the bench. • ETI modelling of 2050 indicates up to 18 GW of Offshore Wind generating capacity would be economic for the UK • Assumes other technologies (e.g. Nuclear, CCS and Biomass) deliver on performance and timeliness
Technology intervention that reduces LCoE can make a big impact on actual level of offshore wind deployed • If Levelised Cost of Energy (LCOE) achieves <£90/MWhr by 2030 • ETI modelling indicates installed capacity would increase substantially • Offshore Wind appears in the “opening team”
Technology intervention that reduces LCoE can make a big impact on actual level of offshore wind deployed • If Levelised Cost of Energy (LCOE) achieves <£90/MWhr by 2030 • ETI modelling indicates installed capacity would increase substantially • Offshore Wind start to appear in the “opening team” • With alternative assumptions, the importance of Offshore Wind increases further • Nuclear, CCS or Biomass deployed at less than reference case • Highly likely that Offshore Wind hedging will be needed
Example of Offshore Wind as a “CCS Hedge” Optimised 2050 world (i.e. with CCS) Optimised 2050 world without CCS available
Reports from DECC and The Crown Estate identify the key cost reduction areas
Reports from DECC and The Crown Estate identify the key cost reduction areas • Bigger, better turbines
Reports from DECC and The Crown Estate identify the key cost reduction areas • Bigger, better turbines • With bigger, more efficient blades
Reports from DECC and The Crown Estate identify the key cost reduction areas • Bigger, better turbines • With bigger, more efficient blades • Installed more cheaply
Reports from DECC and The Crown Estate identify the key cost reduction areas • Bigger, better turbines • With bigger, more efficient blades • Installed more cheaply • With improved, system, cost of energy
Reports from DECC and The Crown Estate help ETI identify the key cost reduction areas • Bigger, better turbines • With bigger, more efficient blades • Installed more cheaply • With improved, system, cost of energy • Accessing better wind resource
Reports from DECC and The Crown Estate identify the key cost reduction areas • Bigger, better turbines • With bigger, more efficient blades • Installed more cheaply • With improved, system, cost of energy • Accessing better wind resource • Benefitting from volume economics
Reports from DECC and The Crown Estate help ETI identify the key cost reduction areas • Bigger, better turbines • With bigger, more efficient blades • Installed more cheaply • With improved, system, cost of energy • Accessing better wind resource • Benefitting from volume economics • With clear returns for stakeholders
Reports from DECC and The Crown Estate identify the key cost reduction areas • Bigger, better turbines • With bigger, more efficient blades • Installed more cheaply • With improved, system, cost of energy • Accessing better wind resource • Benefitting from volume economics • With clear returns for stakeholders • Ability to test new innovation quickly
Reports from DECC and The Crown Estate identify the key cost reduction areas • Bigger, better turbines • With bigger, more efficient blades • Installed more cheaply • With improved, system, cost of energy • Accessing better wind resource • Benefitting from volume economics • With clear returns for stakeholders • Ability to test new innovation quickly What are the disruptive technologies going to be?
The ETI has projects that tackle 4 of these areas Bigger Better Turbines With higher rated power and higher reliability Offshore Wind Drive Train Test Facility at Narec
The ETI has projects that tackle 4 of these areas Bigger Better Turbines With higher rated power and higher reliability Offshore Wind Drive Train Test Facility at Narec Bigger, more efficient blades Accelerating deployment of very long blades project larger swept area Lighter Improved manufacturing, with better tolerances
The ETI has projects that tackle 4 of these areas Bigger Better Turbines With higher rated power and higher reliability Offshore Wind Drive Train Test Facility at Narec Condition Monitoring Bigger, more efficient blades Accelerating deployment of very long blades project larger swept area Lighter Improved manufacturing, with better tolerances Installed More cheaply Floating Offshore System Demonstrator Accessing better wind resources (in deeper water) Floating Offshore System Demonstrator
<70%/KWh target cost – floating 80%/KWh reference cost – floating • Average wind speeds over UK waters which are 50-100m deep range from 9-12 m/s • Cost figures from ETI design and cost modelling projects Opportunities • Energy yield proportional to (wind speed)3 • 11 m/s wind (Western Isles) offers >180% of the energy of 9 m/s wind (Dogger Bank) • Highest mean wind speeds are in Scottish waters off the South West coast of England. • Short distances to shore in SW England 100%/KWh Current cost – fixed structure <75%/KWh target cost – floating
Why floating wind? • Floating foundations will cost less than fixed foundations somewhere in range 30m to 100m
Why floating wind? • Floating foundations will cost less than fixed foundations somewhere in range 30m to 100m • Access to higher wind speeds to west of UK in 60m to 100m water depth could be cheaper than current UK R3 sites • Higher mean wind speed • Closer to shore • Reduced O&M costs • Reduced cabling costs and losses • Shore build and tow out
Floating wind: Benefits and concerns Benefits • Potential for competitive cost of energy • Access to areas of higher wind speed • Production line approach • Maximise work shore side, reducing impact of weather and offshore working • May reduce requirement for specialist ships • Existing demonstrators have performed well
Floating wind: Benefits and concerns Benefits • Potential for competitive cost of energy • Access to areas of higher wind speed • Production line approach • Maximise work shore side, reducing impact of weather and offshore working • May reduce requirement for specialist ships • Existing demonstrators have performed well Concerns • Needs demonstrators to build investor confidence • Higher winds are linked with more severe sea state • Technology route not clear • Technology and operational issues not well understood • May require specialist ships • Constraints from competing use of deeper water • Shipping, fishing, military
Several floating wind approaches • Spar Buoy • Hywind • Demonstrated off Norway • Needs deeper water than most of UK waters • Semi-submersible • Wind Float • Demonstrated off Portugal • Concrete barges • Eg Ideol • Tension Leg Platform • Glosten TLP • Potentially a light hull; with higher vertical load mooring challenges • Could provide very attractive energy costs • Good additionality for an ETI investment
Floating Offshore Wind System DemonstratorUp to £25m project • Front End Engineering Design (FEED study) • TLP approach • Best “additionality for ETI” • Led by Glosten Associates • Alstom 6MW turbine • Contracts signed February 2013 • 12 month project • Preferred site: Wave Hub, off NW coast of Cornwall • Followed, if good enough investment case, by full scale demonstrator • In water 2015/16
Glosten’s PelaStar TLP Technology • Lightweight Steel Hull • Synthetic Tendons • Production line approach, with Quay-side Turbine Assembly • Efficient Farm Layout • Potential for an attractive cost of energy • Enough for Offshore Wind to be part of the 2050 opening line up
Bigger, more efficient blades is a key contributor to lowering energy costs • ETI has commissioned a project with Blade Dynamics to develop next-generation blades using unique seamless modular technology. • Blade Dynamics claim their will be transformational in their performance and reliability • enabled by a fundamentally different manufacturing approach • 3 year project • £15.5m project cost • Technology could lead to a 3% to 5% reduction in energy costs • Building 80m+ blade in the UK by Summer 2014 • Designing ≈100m blade
Based on Blade Dynamic’s 49 2MW Technology • Weighing only 6150kg, the lightest blade in its class • Awarded world blade of the year 2012 by Windpower Monthly • GL tested and certified
Industrialization of blade manufacture Conventional Blade Factory Blade Dynamics Factory • Ultra-large components • Difficult manufacturing process • Quality difficulties • Heavy blades • High CAPEX • Small component manufacture • Simple subcomponent assembly • High quality • Lightweight • Low CAPEX
MODULAR MANUFACTURING TECHNOLOGY BLADESHIELD EROSION PROTECTION PATENTED ROOT TECHNOLOGY
Key messages • To “earn its place” in the 2050 UK energy mix, offshore wind needs to reduce Levelised Cost of Energy • Main hedging option if other technologies don’t deliver their full potential; Nuclear, CCS, Bio-energy and Demand Management • Technology innovation will • Help reduce costs • Make a big difference to the amount of offshore wind deployed in 2050 • ETI is active in key technology innovation areas that have potential to drive down costs • Floating offshore wind has potential to make offshore wind part of the technology starting line up for 2050; rather than the best reserve • Lighter, longer blades have potential to reduce costs by 3% to 5% • And other areas • Drive Train Test Rig
Key messages • To “earn its place” in the 2050 UK energy mix, offshore wind needs to reduce Levelised Cost of Energy • Main hedging option if other technologies don’t deliver their full potential; Nuclear, CCS, Bio-energy and Demand Management • Technology innovation will • Help reduce costs • Make a big difference to the amount of offshore wind deployed in 2050 • ETI is active in key technology innovation areas that have potential to drive down costs • Floating offshore wind has potential to make offshore wind part of the technology starting line up for 2050; rather than the best reserve • Lighter, longer blades have potential to reduce costs by 3% to 5% • And other areas • Drive Train Test Rig