Download
1 / 13
130 likes | 134 Views
An Integrated Variable Speed Limit (VSL) system that dynamically changes speed limits based on traffic conditions to minimize recurrent highway congestion. Includes traffic sensors, a database, communication infrastructure, variable message signs, and control algorithms.

E N D
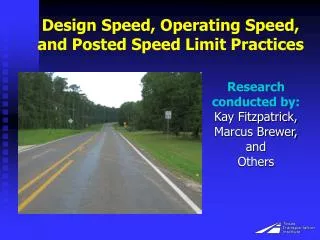
Integrated Variable Speed Limit Control to Minimize Recurrent Highway Congestions
What is Variable Speed Limit (VSL)? • A Variable Speed Limit (VSL) system: • will change the speed limit dynamically • based on the prevailing traffic conditions
What does VSL include? Traffic sensors Database & communications Variable message signs Control algorithms (Speed limit) SPEED 45
Why Use VSL? Smooth speed transition Mitigate traffic congestion Improve traffic safety
Field Demonstration Site • Location Map N 40mph Travel time: Free flow: 180 sec Congested: 600 sec 25mph Baltimore 20mph 50mph 60mph Project location Washington DC • MD-100 • Two-lane highway in each direction • Speed limit 55 MPH • High accident frequency (39 in 2008) • High and dynamic traffic demand during peak hours • Rapid speed drop at merging areas
System Design Control • Descriptions 2 pairsLPR cameras • Matching LPs to • calculate travel Times • Location Map N • HD sensors • Speed, volume (30 seconds) 4 Detectors Baltimore 1 2 3 4 4 2 VSL • Display the control speeds • from algorithm 3 A B • Displays advisory messages • Travel Time and/or • “reduced speed ahead” 2 VMS 2 1 A B Washington DC SPEED SPEED SPEED SPEED 35 45 35 45
Data Collection Plan No Control VSL and travel time display Travel time display only VSL only
Results (Speed for different locations) Advantages 1. Reduce Accidents 2. Increase Speeds 3. Reduce Fuel Consumptions VSL Control MD 170 MD 713 MD 295 Coca Cola Dr.
Results (Travel Time) 25% No Control VSL Only TT Display Only VSL & TT Display
Results (Throughput over different periods) 3980 3848 3941 3713 2045 2036 1974 1883 *The Peak-Period of 30 Minutes **The Peak-Period of 1 Hour
Current Development Source: FHWA
Thanks & Questions? More info: attap.umd.edu