Download
1 / 15
150 likes | 152 Views
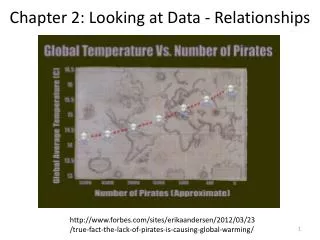
Looking at Data-Relationships. 2.1 –Scatter plots. Definitions. Scatter plot -shows relationship between two quantitative variables measured on the same individuals Explanatory variable -a variable may explain or even cause changes in another

E N D
Looking at Data-Relationships 2.1 –Scatter plots
Definitions • Scatter plot-shows relationship between two quantitative variables measured on the same individuals • Explanatory variable-a variable may explain or even cause changes in another • Response variable-a variable changes with explanatory variables • Scatter plot axis –x axis(explanatory variable), y axis(response variable) • Examining a scatter plot • Overall pattern(linear, non-linear, quadratic, etc) and deviations • Overall pattern of scatter plot by form( line, parabola),direction( positive, negative), and strength( strong, weak) of the relationship • An important kind of deviation is an outlier • Positive association(high values of the two variables tend to occur together) • Negative association(high values of one variable tend to occur with low values of the other variable) • Strength-the strength of a relationship is determined by how close the points in the scatter plot lie to simple form such as line
Prep work • Do problem 2.7 in the text book. Store second-test scores in list L3 & Final-exam score in list L4 • Do problem 2.11
Looking at Data-Relationships 2.2 –Correlation
Definitions • Correlation r- measures the direction and strength of the linear(straight line) association between two quantitative variables x & y • You can calculate a correlation for any scatter plot, r measures only linear relationships • r>0 ->positive association • r<0 ->negative association • r between -1 & 1 including endpoints • Perfect correlation , r=+ or – 1 occurs only when the points lie exactly on a straight line • Formula for the correlation coefficient between x & y- standard deviation of x= • Correlation ignores the distinction between explanatory and response variables • Correlation not resistant-outliers can greatly change the value of r
Prep work- • Do problem 2.29. Store price in list L5 & deforestation in list L6
Looking at Data-Relationships 2.3 –Least-Squares Regression
Definitions • Regression line- • a straight line that describes the relationship between x & y • Requires an explanatory variable & a response variable • Fitting a line to data- • Extrapolation- Use of a regression line for prediction far outside the range of values of the explanatory variable x used to obtain the line
Definitions • Least-squares regression line of y on x- • a line that makes the sum of the squares of the vertical distances of the data points from the line as small as possible • Requires an explanatory variable & a response variable • Equation of the Least-squares regression line - • in regression- is the fraction of the variation in the values of y that is explained by the least-squares regression of y on x
Looking at Data-Relationships 2.4 –Cautions about Correlation and Regression
Definitions • Residuals • Difference between an observed value of the response and the value predicted by the regression line • Requires an explanatory variable & a response variable • Residual equation • Special property: the mean of the least-squares residuals is always zero • Residual Plots: a scatter plot of regression residual against the explanatory variable. Help us to assess the fit of a regression line
Definitions • Outlier-An observation that lies outside the overall pattern • Influential observations-if removed it would change the result of the calculation • Lurking variable: a variable that is not among explanatory or response variables but yet may influence the interpretation of relationships among those variables • Association does not imply causation
Prep work-Brain Activity vs. Empathy score example Will women who are higher in empathy respond more strongly when their partner has a painful experience? 1)Store empathy scores in list L1 & Brain activity in list L2 2)Use the TI-84 to find the equation of the least-squares regression line of brain activity on empathy score (use 4 decimals for coefficients) 3)Use the equation to predict the empathy score for subject 1 4)Find the residual for subject 1 5)Subject 16 can be considered as a possible outlier, find the equation of the least-squares regression line of brain activity on empathy score without this outlier
Looking at Data-Relationships 2.6 –The Question of Causation
Definitions • Some observed associations between two variables are due to a cause-and-effect relationship between these variables, but others are explained by lurking variables • The effect of lurking variables can operate through common response if changes in both explanatory and response variables are caused by changes in lurking variables. • Confounding of two variables(either explanatory or lurking variables) means that we cannot distinguish their effects on the response variables