Download
1 / 21
210 likes | 215 Views
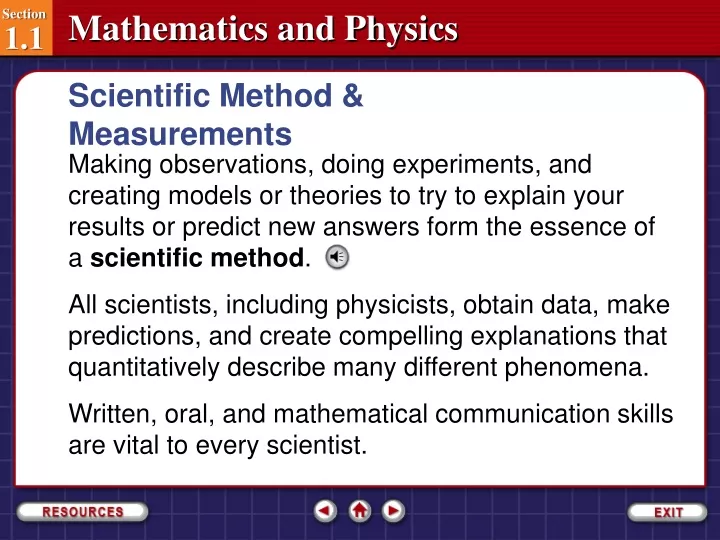
Scientific Method & Measurements. Making observations, doing experiments, and creating models or theories to try to explain your results or predict new answers form the essence of a scientific method .

E N D
Scientific Method & Measurements Making observations, doing experiments, and creating models or theories to try to explain your results or predict new answers form the essence of a scientific method. All scientists, including physicists, obtain data, make predictions, and create compelling explanations that quantitatively describe many different phenomena. Written, oral, and mathematical communication skills are vital to every scientist. Section 1.1-27
Scientific Methods The experiments and results must be reproducible; that is, other scientists must be able to recreate the experiment and obtain similar data. A scientist often works with an idea that can be worded as a hypothesis, which is an educated guess about how variables are related. Section 1.1-28
Scientific Methods A hypothesis can be tested by conducting experiments, taking measurements, and identifying what variables are important and how they are related. Based on the test results, scientists establish models, laws, and theories. Section 1.1-29
Models, Laws, and Theories An idea, equation, structure, or system can model the phenomenon you are trying to explain. Scientific models are based on experimentation. If new data do not fit a model, then both the new data and the model are re-examined. Section 1.1-30
Models, Laws, and Theories If a very well-established model is questioned, physicists might first look at the new data: Can anyone reproduce the results? Were there other variables at work? If the new data are born out by subsequent experiments, the theories have to change to reflect the new findings. Section 1.1-30
Models, Laws, and Theories In the nineteenth century, it was believed that linear markings on Mars showed channels. As telescopes improved, scientists realized that there were no such markings. In recent times, again with better instruments, scientists have found features that suggest Mars once had running and standing water on its surface. Each new discovery has raised new questions and areas for exploration. Section 1.1-31
Models, Laws, and Theories A scientific law is a rule of nature that sums up related observations to describe a pattern in nature. Section 1.1-32
Models, Laws, and Theories The animation above shows how a scientific law gets established. Notice that the laws do not explain why these phenomena happen, they simply describe them. Section 1.1-32
Models, Laws, and Theories A scientific theory is an explanation based on many observations supported by experimental results. A theory is the best available explanation of why things work as they do. Theories may serve as explanations for laws. Laws and theories may be revised or discarded over time. In scientific use, only a very well-supported explanation is called a theory. Section 1.1-33
In this section you will: • Distinguish between accuracy and precision. • Determine the precision of measured quantities. Section 1.2 1
What is a Measurement? A measurement is a comparison between an unknown quantity and a standard. Measurements quantify observations. Careful measurements enable you to derive the relationship between any two quantities. Section 1.2 2
Comparing Results When a measurement is made, the results are often reported with uncertainty. Therefore, before fully accepting new data, other scientists examine the experiment, looking for possible sources of errors, and try to reproduce the results. A new measurement that is within the margin of uncertainty confirms the old measurement. Section 1.2 3
Precision Versus Accuracy https://www.youtube.com/watch?v=hRAFPdDppzs Section 1.2 4
Precision Versus Accuracy https://www.youtube.com/watch?v=b38hFWvEjwI Section 1.2 4
Techniques of Good Measurement To assure precision and accuracy, instruments used to make measurements need to be used correctly. This is important because one common source of error comes from the angle at which an instrument is read. Section 1.2 5
Techniques of Good Measurement To understand this fact better, observe the animation on the right carefully. Section 1.2 5
(a) (b) Techniques of Good Measurement Scales should be read with one’s eye straight in front of the measure. If the scale is read from an angle, as shown in figure (b), you will get a different, and less accurate, value. Section 1.2 6
Techniques of Good Measurement The difference in the readings is caused by parallax, which is the apparent shift in the position of an object when it is viewed from different angles. Section 1.2 6
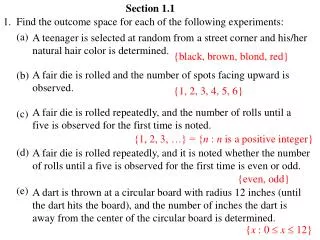
Question 1 Ronald, Kevin, and Paul perform an experiment to determine the value of acceleration due to gravity on Earth (which most scientists agree is about 980 cm/s2). The following results were obtained: Ronald — 961 ± 12 cm/s2, Kevin — 953 ± 8 cm/s2, and Paul — 942 ± 4 cm/s2. Determine who has the most accurate and precise value. Section 1.2 7
Question 1 A. Kevin got the most precise and accurate value. B. Ronald’s value is the most accurate, while Kevin’s value is the most precise. C. Ronald’s value is the most accurate, while Paul’s value is the most precise. D. Paul’s value is the most accurate, while Ronald’s value is the most precise. Section 1.2 7
Answer 1 Reason:Ronald’s answer is closest to 980 cm/s2. Hence, Ronald’s result is the most accurate. However, Paul’s error is only ±4 cm/s2. Hence, Paul’s result is the most precise. Section 1.2 8