Download
1 / 8
80 likes | 82 Views
This study identifies upregulated and downregulated transcripts in tolerance using negative depletion FACS purification method. The data includes the purification method discernible by color and responses of IgHEL and B6 cells.

E N D
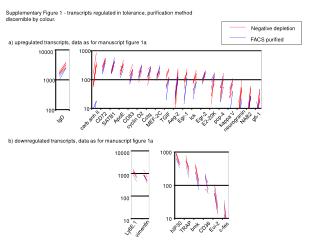
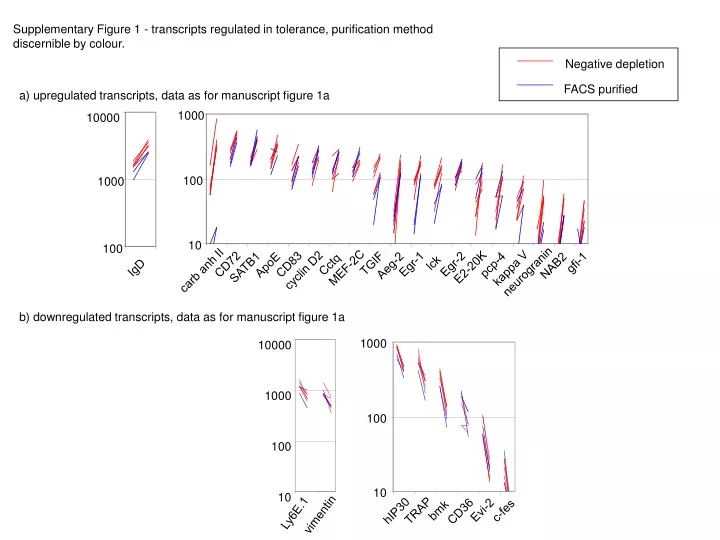
Negative depletion FACS purified Supplementary Figure 1 - transcripts regulated in tolerance, purification method discernible by colour. a) upregulated transcripts, data as for manuscript figure 1a 1000 10000 100 1000 10 100 gfi-1 lck TGIF Egr-1 Egr-2 CD72 CD83 Cctq pcp-4 ApoE Aeg-2 NAB2 SATB1 E2-20K IgD MEF-2C kappa V cyclin D2 carb anh II neurogranin b) downregulated transcripts, data as for manuscript figure 1a 1000 10000 1000 100 100 10 10 Evi-2 bmk c-fes TRAP hIP30 CD36 Ly6E.1 vimentin
Negative depletion FACS purified c) contaminating myeloid transcripts depleted by FACS purification 10000 1000 100 10 1 2ndary granule MRP14 lipocalin 2 MRP8 d) contaminating erythroid transcripts depleted by FACS purification 1000 100 10 BPGM amino ferrochelatase levulinate band 3 carb anh II snthse
IgHEL cells +/- HEL Supplementary Figure 2a - upregulated transcripts after 1 hour activation, responses of IgHEL and B6 cells discernible by colour. Data as for manuscript figure 2a B6 cells +/- anti-mu 10000 1000 100 10 1 gfi-1 EZF AhR c-fos Egr-1 Egr-2 mafK TIS11 Nur77 LSIRF NAB2 Fos B Stra13 c-myc TIS11b LRG-21 gadd153 C/EBP beta 10000 1000 100 10 1 CD72 RP105 PEP TIS7 uPAR MIP-1 a EBI2 MKP1 MIP-1 b MyD116 Evi-2 4F2 kir/gem SNK IL1-R2 A1 hRab30 PAC-1 BL34 BL34 MacMARCKS
1 Id3 Supplementary Figure 2b - downregulated transcripts after 1 hour activation. Data as for manuscript figure 2b IgHEL cells +/- HEL B6 cells +/- anti-mu 10000 1000 100 10 B29 G7e EFP NAG bcl-3 scd2 Stat1 LKLF hRhoH iap38 SLAP BKLF GILZ GILZ TRAF5 IFNg-RII hIFI-204 LT-beta gadd45 mCDC47 Caspase2 Kappa 0 ig
Supplementary Figure 3a - upregulated transcripts after 1 hour activation in presence of FK506. Data presented as for manuscript figure 3a IgHEL cells +/- HEL B6 cells +/- anti-mu 10000 1000 100 10 1 4F2 TIS7 EZF gfi-1 SNK c-fos Egr-1 mafK Nur77 TIS11 BL34 BL34 uPAR NAB2 Fos B Stra13 RP105 PAC-1 LRG-21 gadd153 C/EBP beta 10000 1000 100 10 1 A1 AhR EBI2 PEP Evi-2 Egr-2 c-myc LSIRF IL1-R2 MKP1 TIS11b kir/gem MIP-1 b MIP-1 a hRab30 MyD116 MacMARCKS
Supplementary Figure 3b - downregulated transcripts after 1 hour activation in presence of FK506. Data presented as for manuscript figure 3b IgHEL cells +/- HEL B6 cells +/- anti-mu 10000 1000 100 10 1 Id3 B29 GILZ GILZ G7e EFP NAG bcl-3 scd2 Stat1 LKLF iap38 SLAP BKLF hRhoH TRAF5 IFNg-RII hIFI-204 LT-beta gadd45 CDC47 caspase 2 kappa 0 ig
3000 2500 2000 1500 1000 500 0 GILZ SLAP LKLF LT-beta Stat1 iap38 kappa hIFI- GILZ BKLF EFP Id3 Supplementary Figure 4a - 1 hour response genes that were affected by in vitro incubation Genes upregulated by antigen, 1 hour 2500 - incubation 2000 + incubation 1500 hybridisation intensity 1000 Data shown are for 1 hr response genes that showed a significant effect of incubation. Blue bars represent IgHEL samples directly lysed after purification, purple bars show IgHEL cells that were mock stimulated by incubation on tissue culture plastic for 1 hour. Error bars are 1 standard deviation. Genes not shown were not affected by in vitro incubation. 500 0 EBI2 4F2 EZF TIS7 Evi-2 MKP1 TIS11 gfi-1 uPAR Ah-R c-fos Fos B RP105 TIS11b IL1-R2 Nur77 MIP-1 a Stra13 MyD116 gadd153 MacMARCKS downregulated by incubation upregulated by incubation Genes downregulated by antigen, 1 hour hybridisation intensity 0 ig 204 downregulated by incubation upregulated by incubation
Supplementary Figure 4b - 1 and 6 hour response genes that were affected by in vitro incubation Unchanged by incubation Increased by incubation Downregulated by antigen at 1 hr Upregulated by antigen at 1 hr Decreased by incubation 1000 10000 1000 In vitro incubation does not resemble a partial activation response as many transcripts are regulated in different directions by antigen and in vitro incubation 100 incubation incubation 100 10 10 1 1 1 10 100 1000 10000 1 10 100 1000 10000 No incubation No incubation Downregulated by antigen at 6 hr Upregulated by antigen at 6 hr 10000 10000 1000 1000 100 incubation 100 incubation 10 10 1 1 1 10 100 1000 10000 1 10 100 1000 10000 No incubation No incubation