Download
1 / 26
260 likes | 346 Views
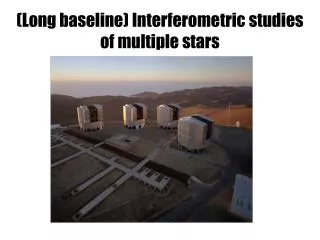
Interferometric Observations of Supergiants: Direct Measures of the Very Largest Stars. Gerard T. van Belle PRIMA Instrument Scientist European Southern Observatory April 7, 2008. Interferometric Observations of Supergiants: Direct Measures of the Very Largest Stars. Gerard T. van Belle

E N D
Interferometric Observations of Supergiants:Direct Measures of the Very Largest Stars Gerard T. van Belle PRIMA Instrument Scientist European Southern Observatory April 7, 2008
Interferometric Observations of Supergiants:Direct Measures of the Very Largest Stars Gerard T. van Belle PRIMA Instrument Scientist European Southern Observatory March 17, 2009 M Dwarfs Smallest
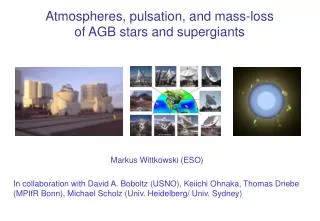
Back of the Envelope Estimate: Supergiants • Guesstimates (things we think we know): • Main sequence stars: 1 M, 1 R • Supergiant stars: : 10 M, 100 R • Stellar lifetime T goes as T ~ M-4 • There are ×104 fewer supergiants than main sequence stars • Supergiants are ~104 times brighter: will be detectable at a distance 100× further than main sequence stars • A volume ×106 greater • Number of observable targets goes linearly with volume • Ergo, 102 more supergiants to observe at a given apparent size • Most main sequence stars <1 R, and most supergiants >100 R, so things are even better than this estimate Supergiants are obvious targets for interferometers!
Back of the Envelope Estimate: M-Dwarfs • Guesstimates (things we think we know): • Solar-type stars: 1 M, 1 R • M-dwarfs stars: : 0.4 M, 0.4 R • Stellar lifetime T goes as T ~ M-4 • There are ×40 more M-dwarfs than solar-type stars • M-dwarfs are ~100× fainter: will be resolvable at a distance 10× smaller than main sequence stars • A volume ×103 smaller • Number of observable targets goes linearly with volume • Ergo, 25× fewer M-dwarfs to observe at a given apparent size • Already difficult to resolve more massive main sequence stars (solar type) due to small size M-dwarfs are not obvious targets for interferometers! 4
Essential Astrophysics: The HR Diagram • Track/model stellar evolution • Fundamental stellar properties • Luminosity • Radius • Temperature • Examine properties of groups of stars • Clusters, associations
CHARA of Yesteryear: M-Dwarf Diameters Berger+ 2006 Seiss+ 1997 models Chabrier & Baraffe (1997) models
Metallicity Dependency of Diameter Deviation? Berger+ 2006 Measured diameters versus Chabrier & Baraffe (1997) models
Basic Parameters from Angular Diameters () • Direct observation of fundamental stellar parameters • Effective temperature is defined as: which can be rewritten as: • FBOL is the bolometric flux (W cm-2), qR is the Rosseland mean stellar angular diameter (mas) • Linear radius is simply: • Hipparcos (Perryman et al. 1997) distances now available • For those M-dwarfs that are resolvable, they tend to be bright enough to have Hipparcos distances • But many nearby stars are too dim for good distances
Nuances of FBOL Fitting • Stars are not blackbody radiators • Especially cool dwarfs: many features • Spectral type estimates • Heterogeneous sources? By type (objective prism, slit spectroscopy, etc.) or practitioner • Spectral type template • Empirical model (Pickles 1998) versus theoretical model (eg. Hauschildt’s NextGen models) • Photometry • Wide- and narrow-band can be used usefully • However, peak of flux curve at ~1μm for many M-dwarfs: most photometry here is quite poor • Reddening • Can be degenerate with spectral type estimate in doing SED fitting • Not a significant factor for M-dwarfs
Limb darkening • Stars are not uniform disks • Gaseous, not solid, sphere • End up looking ‘into’ the star • Good and bad • Have to account for this • Measuring this can be used to characterize internal structure of star • Direct probe of internal temperature structure • For M-dwarfs, a model atmosphere will provide a correction factor from UD to LD • Correct account of molecular features? (Here be dragons!) HST Image of a Ori - Betelgeuse
Uniform disk Limb darkened disk Limb darkening. II • Effects are less striking in the near-IR • Most of the effects are seen at the higher spatial frequencies • Acceptable to do a UD fit, and scale • Gives the size of the mean radiating surface • Corrections are ~2% for M-dwarfs • Scales with temperature • Cooler → LD/UD↑ A-type Star Model (Claret et al. 1995)
Current Stock of Results • Borrowing from Davis (1997), increase of 145 to 340 stars in the literature (as of ~2003) • Notable improvement: Application of interferometry to evolved stars • Notable area for improvement: Still main sequence stars, particularly late-type, and supergiants • Homogenous, large datasets are absent from the literature for both Previous CHARA work : 6 Diameters This work: 11 (and counting)
Effective Temperature versus V-K Most straightforward quantity: TEFF “All V-K is good for is estimates of TEFF” This is not necessarily a bad thing A significantly more robust index than spectral type Down to 3500K, curve seems fairly linear with V-K At TEFF<3500K, curve seems to flatten out
Effective Temperature versus V-K Red points: PTI data Seems to bear out trend down to 3500K Highlights power of CHARA, though, with smallest stars Low TEFF versus V-K curve ‘flattening’ seen before: Miras For Miras, was explained in terms of MOLsphere
Linear Radius versus V-K Significant amounts of scatter seen as a function of V-K eg. at V-K~4.0, factors of 2× see in linear radius As with TEFF, starting to see 2nd order effects? Age? [Fe/H]? Or just evidence that V-K poor proxy for R?
Linear Radius versus V-K Red points: PTI data Some scatter as well (but not as much) Different V-K regime
Influence of [Fe/H] in Linear Radius? Ranges from [Fe/H]=-1.5 (small bubble) to +0.50 (big bubble) Interesting low [Fe/H] outliers at V-K~4 Average value of -0.35 [Neglected to provide [Fe/H] for PTI data yet]
Radius versus Mass Mass from mass-MK relationship found in Delfosse+ (2000) Green points: Berger+ (2006) CHARA Blue: new CHARA Red line: Chabrier & Baraffe (1997) model ([Fe/H]=0) Region of interest: 0.40-0.60 M Convection peculiarities in models? Missing from new data Deviations due to spotting?
Temperature versus Radius More ‘robust’ and model-independent than measures of M, [Fe/H] However, a bit of plotting θ vs. θ FBOL data is the additional information As with TEFF vs. V-K, linear trend down to 3500K(?) with ‘pedestal’ at <3500K?
Temperature versus Radius Red points: PTI data <3500K ‘pedestal’: 2nd order TEFF effects dominating? Age, [Fe/H]?
Temperature versus Radius: Relationship of Mass? Mass effect in T vs R? Bubble size a function of mass 0.25-0.86 M
Remember this Plot? Berger+ 2006
Things Look a Little Different Difficult to reproduce Nominally includes Berger+ 2006 data How to derive ‘predicted’ R values from CB97? MV→MBOL with BC(TEFF)→L →R(L) Oh, and [Fe/H] values for M-dwarfs? All over the place
The ‘To-Do’ List Further CHARA observations In the ‘sweet spot’ of R={0.5,0.8} R, V-K={2.25,3.25}, M={0.4,0.6} M Better precision? Currently at σθ/ θ~ 4.5% Possible with repeating measures? Better supporting information [Fe/H] Homogenous measures a plus Broad-band photometry: R,I (z?) bands FBOL errors reported at ~1%, but with χν2>>1 Chase after the new generation of models