Download
1 / 30
300 likes | 600 Views
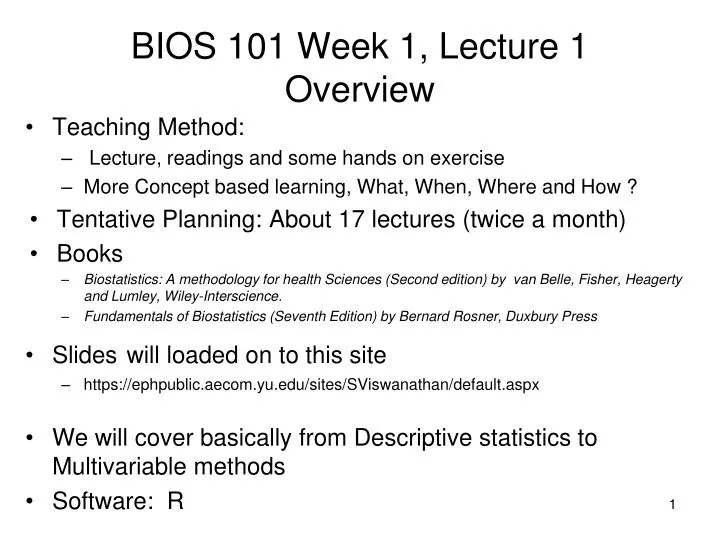
BIOS 101 Week 1, Lecture 1 Overview. Teaching Method: Lecture, readings and some hands on exercise More Concept based learning, What, When, Where and How ? Tentative Planning: About 17 lectures (twice a month) Books

E N D
BIOS 101 Week 1, Lecture 1Overview • Teaching Method: • Lecture, readings and some hands on exercise • More Concept based learning, What, When, Where and How ? • Tentative Planning: About 17 lectures (twice a month) • Books • Biostatistics: A methodology for health Sciences (Second edition) by van Belle, Fisher, Heagerty and Lumley, Wiley-Interscience. • Fundamentals of Biostatistics (Seventh Edition) by Bernard Rosner, Duxbury Press • Slideswill loaded on to this site • https://ephpublic.aecom.yu.edu/sites/SViswanathan/default.aspx • We will cover basically from Descriptive statistics to Multivariable methods • Software: R
Article Discussion • Chang et.al “Treatment results of hypopharyngeal cancer by different treatment startegies and its secondary primary- experience in Taiwan”, Radiation oncology, 2010, 5:91 • WHAT is the study about and what is important in the article
BIOS 101 Week 1, Lecture 1An Introduction to R • R is a statistical language and environment for data analysis and display. • The syntax of R is almost the same as that of S (or S-Plus). • R is free! It is open-source and involves many developers. • R is object-oriented • R/Splus are good packages for certain kinds of graphics and data exploration • R is flexible, but also pretty low level for certain types of tasks. Thus you might take longer to set up a regression analysis in R than in, say, SAS. But other types of analysis or plots can be much simpler in R.
Main page at http://www.r-project.org/ In the words of the developers, R is/has: • an effective data handling and storage facility, • a suite of operators for calculations on arrays, in particular matrices, • a large, coherent, integrated collection of intermediate tools for data analysis, • graphical facilities for data analysis and display either on-screen or on hardcopy, and • a well-developed, simple and effective programming language which includes conditionals, loops, user-defined recursive functions and input and output facilities.
Links for downloads Pre-compiled binaries for most systems of interest
Many useful R packages are not included in the base distribution, and must be added • Students are responsible for getting R on a machine they can use (ask me if you need help!). It’s a snap to install on a PC • E.g., Start->Programs->Statistical Applications->R or something similar • I will follow some parts from “An Introduction to R” (Venables/Smith/Gentleman R Core Development Team) at http://cran.r-project.org/doc/manuals/R-intro.pdfand “R for Beginners” (Paridis) http://cran.r-project.org/doc/contrib/Paradis-rdebuts_en.pdf
I will describe the interactive shell mode (text window) command-line use of R. • For windows machines, a graphical interface appears, but here I will use the “console” window, so it’s pretty much the same as with the Unix machines. • I will follow some parts from “An Introduction to R” (Venables/Smith/Gentleman R Core Development Team) at http://cran.r-project.org/doc/manuals/R-intro.pdf and “R for Beginners” (Paridis) http://cran.r-project.org/doc/contrib/rdebuts_en.pdf • Also I will make comments about things I have found useful
A schematic view of R (from E. Paridis, R for Beginners, 2002)
Object-oriented means that variables, data, functions, results, etc, are stored in the active memory of the computer in the form of objects which have a name. The user can do actions on these objects with operators (arithmetic, logical, and comparison) and functions (which are themselves objects) • Let’s illustrate by starting with the command line in a new session. You’ll see “>” starting each line
I typed “n” and hit return > n Error: Object "n" notfound > n<-10 > n [1] 10 > n=15 > n [1] 15 Doesn’t exist yet Now I assign (using <-) the value 10 to object n Now it exists Alternate way of assigning. However this is a bit dangerous, if you intended a comparison query. If the object already exists, its previous value is erased (the modification affects only the objects in the active memory, not the data on the disk).
> n==20 [1] FALSE > n==15 [1] TRUE > n<10 [1] FALSE > n>10 [1] TRUE > n==n [1] TRUE > a<-15 > a< -15 [1] FALSE > n==a [1] TRUE An assignment. A query.
Functions need an argument, provided in parentheses > a<-10 > sqrt(a) > [1] 3.162278 Object names cannot start with digits or periods, but they can have periods (dots) and digits within them Names are case sensitive Names that are already in use by R (usually as functions) are a bad idea. Single letter names could be a problem, like “t” (used for the transpose function, etc.). But it’s easy to check.
> d Error: Object "d" not found > t function (x) UseMethod("t") <environment: namespace:base> Variable data types – character, numeric, logical > a<-"scooby doo" > a [1] "scooby doo" > is.character(a) [1] TRUE > typeof(a) [1] "character" CHARACTER functions that start with “is” often can answer a question about an object
> a<-10 > is.numeric(a) [1] TRUE > is.character(a) [1] FALSE > > a<-10/sqrt(2) > a [1] 7.071068 > is.numeric(a) [1] TRUE > a^100 [1] 8.881784e+84 > a^1000 [1] Inf > a^(-1000) [1] 0 NUMERIC Too big Too tiny
> a<-T > a [1] TRUE > a<-TRUE > a [1] TRUE > a+1 [1] 2 LOGICAL Treats TRUE as 1, FALSE as zero when numeric operations performed
R as calculator > a<-2 > b<-10 > c<-3 > > (-b+sqrt(b^2-4*a*c))/(2*a) [1] -0.3205505 > (-b-sqrt(b^2-4*a*c))/(2*a) [1] -4.679449
R object types • Vector: • a one-dimensional array of arbitrary length. Subsets of the vector may be referenced. All elements of the vector must be of the same data type--numerical, character, etc. • Matrix: • a two-dimensional array with an arbitrary number of rows and columns. Subsets of the matrix may be referenced, and individual rows and columns of the matrix may be handled as vectors. Again all elements of the matrix must be of the same data type. • Array: • as a matrix, but of arbitrary dimension. Source: http://www.ma.hw.ac.uk/~stan/R/Rnotes.pdf
So far we have assigned a single element to each object. This is a special case of a vector. > a<-c(1,2,3,4) > a [1] 1 2 3 4 > a<-(1:4) > a [1] 1 2 3 4 > typeof(a) [1] "integer" > is.numeric(a) [1] TRUE > is.vector(a) [1] TRUE > The “c” function collects things into a single vector Special case of numeric type
So far we have assigned a single element to each object. This is a special case of a vector. > a [1] 1 2 3 4 > a<-a+1 > a [1] 2 3 4 5 > a<-c(a, "scooby doo") > a [1] "2" "3" "4" "5" "scooby doo" > typeof(a) [1] "character" > What does this do? We say that a was “coerced” into the character data type
I’m impatient. I want to see something cool. > a<-2 > b<-10 > c<-3 > x<-c(-50:50)/10 > > y<-a*x^2+b*x+c > plot(x,y) > abline(0,0) Vector from what value to what value? Another vector Simple scatterplot – two vectors must have elements in the same order Draws a line on a plot with intercept 0 and slope 0
Complex Math. • > a<-c(1:11) • > b<-c(-5:5) > c<-outer(a,b,FUN="*") • > c • [,1] [,2] [,3] [,4] [,5] [,6] [,7] [,8] [,9] [,10] [,11] • [1,] -5 -4 -3 -2 -1 0 1 2 3 4 5 • [2,] -10 -8 -6 -4 -2 0 2 4 6 8 10 • [3,] -15 -12 -9 -6 -3 0 3 6 9 12 15 • [4,] -20 -16 -12 -8 -4 0 4 8 12 16 20 • [5,] -25 -20 -15 -10 -5 0 5 10 15 20 25 • [6,] -30 -24 -18 -12 -6 0 6 12 18 24 30 • [7,] -35 -28 -21 -14 -7 0 7 14 21 28 35 • [8,] -40 -32 -24 -16 -8 0 8 16 24 32 40 • [9,] -45 -36 -27 -18 -9 0 9 18 27 36 45 • [10,] -50 -40 -30 -20 -10 0 10 20 30 40 50 • [11,] -55 -44 -33 -22 -11 0 11 22 33 44 55 Matrix outer product
A single element > c[3,2] [1] -12 A column > c[,2] [1] -4 -8 -12 -16 -20 -24 -28 -32 -36 -40 -44 A row > c[3,] [1] -15 -12 -9 -6 -3 0 3 6 9 12 15 > image(c) Both are vectors Image of a matrix, color corresponds to matrix elements
More complex graph… a<-c(-440:200)/200 b<-c(-300:300)/200 b<-complex(length(b),0,b) c<-outer(a,b,FUN="+") magnitude.c<-sqrt(Re(c)^2+Im(c)^2) z<-matrix(0,length(a),length(b)) for (i in (1:20)){ z<-z^2+c } magnitude.z<-sqrt(Re(z)^2+Im(z)^2) magnitude.z[is.na(magnitude.z)]<-magnitude.c[is.na(magnitude.z)]^500 image(a,Im(b),-log(magnitude.z)*(magnitude.z>10),col=c(heat.colors(100),1)) Okay, this is a little advanced
R object types, cont. • Data frame: • a set of data organized similarly to a matrix. However, each column of the data frame may contain its own type of data. Columns typically correspond to variables in a statistical study, while rows correspond to observations of these variables. A data frame may be handled similarly to a matrix, and individual columns of the data frame may be handled as vectors. • List: • an arbitrary collection of other R objects (which may include other lists). Powerful feature of R Source: http://www.ma.hw.ac.uk/~stan/R/Rnotes.pdf
R object types, cont. • function: • - Doesn’t have a data type. This is an object that takes other objects as arguments and does something with them. • We’ll cover data frames, lists, and functions more next time
Searching for information/functions Needs quotes > help(regression) No documentation for 'regression' in specified packages and libraries: you could try 'help.search("regression")' > > help("regression") No documentation for 'regression' in specified packages and libraries: you could try 'help.search("regression")' > > help("lsfit") > help.search("regression") Wrong name anyway Now we’re getting somewhere (see popup) Searches for anything with `regression’ in it
How to enter and read data • To developing a database, you can enter into any available commercial software such as MS Excel, MS Access • Easy way to upload into R for analysis is by converting either into .csv (comma-separated values) file or .dat (tab delimited file) • Example data: Smoking, Alcohol and Esophageal Cancer data
Data information • Data from a case-control study of esophageal cancer in Ile-et-Vilaine, France • A data frame with records for 88 age/alcohol/tobacco combinations. • Variables: Age group (agegp), Alcohol consumption(alcgp), Tobacco consumption (tobgp), # of cases(ncases), # of controls (ncontrols)
Reading data from.csv or .dat files • > e.csv<-read.table("Esophageal.csv", header=T, sep=",") • > e.dat<-read.table("Esophageal.dat", header=T, sep="\t") • > summary(e.dat) agegpalcgptobgpncasesncontrols 25-34:15 0-39g/day:23 0-9g/day:24 Min. : 0.000 Min. : 1.00 35-44:15 120+ :21 10-19 :24 1st Qu.: 0.000 1st Qu.: 3.00 45-54:16 40-79 :23 20-29 :20 Median : 1.000 Median : 6.00 55-64:16 80-119 :21 30+ :20 Mean : 2.273 Mean :11.08 65-74:15 3rd Qu.: 4.000 3rd Qu.:14.00 75+ :11 Max. :17.000 Max. :60.00
Some basic statistics commands • >mean(e.dat$ncases) • >sd(e.dat$ncases) • >var(e.dat$ncases) • >plot(e.dat$ncases) • >hist(e.dat$ncases)