Download
1 / 9
90 likes | 153 Views
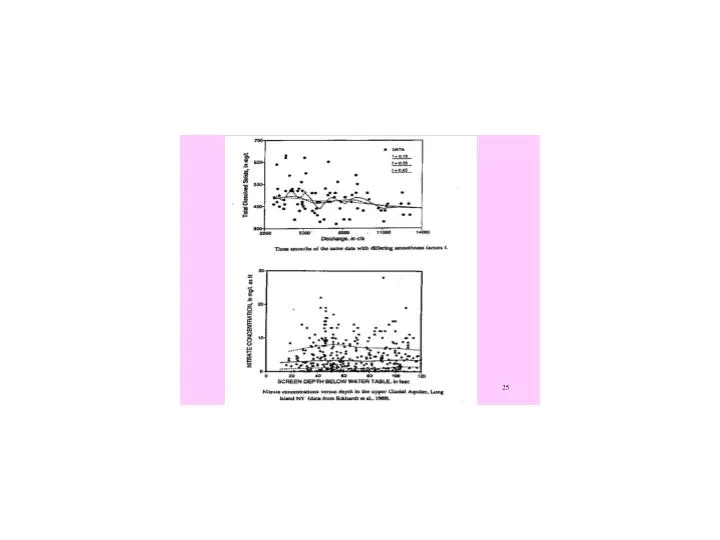
Image from Gene-Chips (Micorrrays). Statistics for microarray analysis (SMA). http://www.stat.berkeley.edu/users/terry/zarray/Software/smacode.html Method: Lowess Goal: adjust systematic bias Assumption: changes roughly symmetric at all intensities within the region considered.

E N D
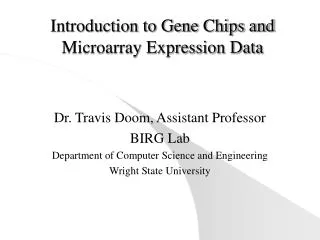
Statistics for microarray analysis (SMA) • http://www.stat.berkeley.edu/users/terry/zarray/Software/smacode.html • Method: Lowess • Goal: adjust systematic bias • Assumption: changes roughly symmetric at all intensities within the region considered
Hierarchical clustering • Technically, Eisen uses average-link agglomerative hierarchical clustering. • Similarity between genes is measured using a Pearson correlation coefficient. • Where to download the software: • http://rana.lbl.gov/EisenSoftware.htm
Why cluster? • Place genes with similar expression profiles into clusters. • What is the gene’s function? • Place experiments / samples with similar expression profiles into clusters. • What is the expression profile of a particular disease or phenotype?