Download
1 / 27
270 likes | 446 Views
A New Oyster for Chesapeake Bay?. An Economic Perspective To Support the Development of an EIS Doug Lipton Department of Agricultural & Resource Economics Maryland Sea Grant Extension Program. Presentation Outline. Overview of Economic Considerations Benefits Costs Risks

E N D
A New Oyster for Chesapeake Bay? An Economic Perspective To Support the Development of an EIS Doug Lipton Department of Agricultural & Resource Economics Maryland Sea Grant Extension Program
Presentation Outline • Overview of Economic Considerations • Benefits • Costs • Risks • A Restored Oyster Market – Price and Production • Other Benefit & Cost Information
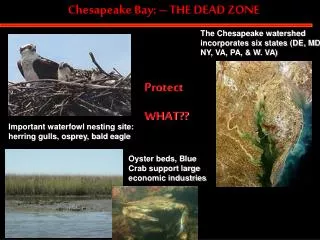
What are the economic benefits of a restored oyster resource in Chesapeake Bay?
Direct Use Benefits • Commercial Fishermen Incomes • Oyster Dealer/Processor Incomes • Oyster Consumers
Indirect Use Benefits • Habitat improvement leading to increased populations of other commercial & recreational species (e.g. striped bass, blue crab) • Water quality • Increased populations of other commercial & recreational species • Boating, swimming & beach use • Increased value of waterfront property • Potential cost savings in achieving mandated water quality standards
Non or Passive Use Value • Existence Value – Exclusive of the direct use of the oyster as a food resource or it’s indirect value in supporting other uses, what are citizen’s of the region willing-to-pay to have a restored oyster population in Chesapeake Bay?
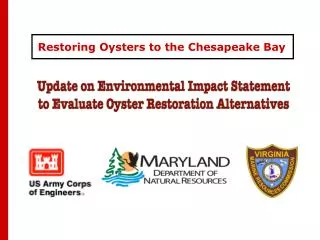
Benefits of C.virginica vs.C. ariakensis • Will one species be more profitable than the other? • Will consumers prefer one species over the other? • Will one species create better habitat for other fish species than the other? • Will one species be more effective in improving water quality than the other? • Does the general public care whether the oyster in Chesapeake Bay is a non-native species? • Will one species generate these benefits significantly more rapidly than the other?
Costs and Risks of C.virginica vs C. ariakensis • Will it be more costly to achieve the population goals with one species compared to the other? • What risks are there in introducing a non-native species into the Chesapeake ecoystem: • Introduce new diseases – diminished probability with ICES Protocol • Be a vector for indigenous disease organisms – e.g., Bonamia sp. in North Carolina • Destroy habitat • Irreversibility • Outcompeting native oyster • Something else we can’t anticipate
A Risk-Time Trade-off Time Risk
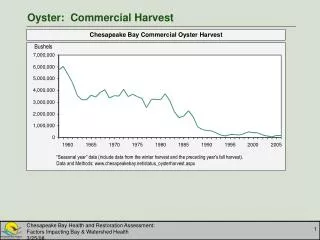
What Will Happen to Oyster Prices if Chesapeake Bay Production Increases? • Stated goal is to increase oyster populations to a level that will result in a sustainable harvest equal to the harvest from the 1920-1970 period. • That’s 4.9 million bushels a year! • Probably was not a sustainable harvest • Overharvesting in early part of the period • Relied on repletion program in latter part • Is this harvest feasible? (Today’s Focus)
A Note About the Impact of Hurricanes Katrina & Rita on Gulf Oysters and the Market • Short-Run Impacts • Water quality concerns? • What is mortality from storms? • Loss of fleet and displacement of fishermen? • Long-Run Impacts
Inverse Demand for Chesapeake Bay Oyster Production • Chesapeake Bay Oyster Price Is a Function Of: • CB production • Production in other regions • A demand shift over time (1979) • Concerns about Vibrio vulnificus in Gulf of Mexico oysters (1991)
Estimate Inverse Demand R2 = 0.79 *Indicates significance at 90% confidence level.
Demand Analysis Results • If the Chesapeake Bay Oyster Fishery Produced 4.9 Million Bushels: • prices would fall from: • 1999-2003 Average of $27 per bushel • to restored fishery price of $10.60 per bushel • Price is Probably Unprofitable • Use Industry Expert Survey of Price to Determine Industry Size
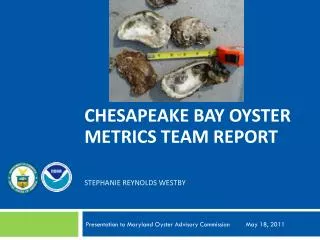
Survey of Oyster Dealers • Oyster Industry believes median projection of bushel price for a “restored” fishery is $18.80 for either species. • Solving inverse demand estimate for this price: • EIS Harvest Goal – 4.9 million bushels • Predicted Actual Harvest – 2.57 million bushels
Some Caveats • The net values may be significantly lower than the gross values, and even zero. • Depends on opportunity costs of time and investments. May be able to earn more money not fishing or processing oysters. • Depends on management system. Property rights such as leased bottom more likely to yield positive benefits than a public fishery where watermen increase harvesting costs in order to catch the same oyster.
Indirect Use Values – Recreational Fishing • Recreational Fishing • Striped Bass Value (Lipton & Hicks, 2003) • Total Value of Striped Bass Fishing in Chesapeake Bay - $77 million (A Risk Factor) • Declines in DO from current levels costly • $6.6 - $9.5 million per year • Improvements from current levels are small • $255 - $320 thousand per year • Other species may benefit as well
Indirect Use Values – Recreational Boaters • Maryland Boaters (Lipton, 2004) • Boaters self-ranked water quality on a Likert scale (1-5) • Annual benefit to moving up one unit in ranking • $8.3 million
Existence Value • In a random digit dial phone survey, 69% of respondents either didn’t know the status of oyster populations in the Bay or thought they were stable or increasing over the past 10 years!
Mandated Nutrient Reduction • Chesapeake Bay Commission’s Cost Effective Measures • Waste Treatment Upgrades - $8.56/lb N • Enhanced Nutrient Management - $4.41/lb N • Cover Crops - $3.13/lb N • Nutrient Management - $1.66/lb N • Conservation Tillage - $1.57/lb N • Diet and Feed Changes - $?/lb N • Gets to 80% of Nutrient Reduction Goal • Getting to the remaining 20% is more expensive and a potential measure of cost savings due to oyster restoration if it is done instead.
Concluding Comments • The dominant difference in the benefits between the two species will be the time frame in which they are realized. • The dominant difference in the costs of the options is due to the unknown risks associated with C.ariakensis • Even if we can quantify in economic terms what is at risk, what probability will we assign to these risks to determine an expected value? We can not do controlled experiments to determine a priori many of these probabilities. • Decision making under large uncertainty calls for a precautionary approach. • What is precautionary is in the eyes of the beholder. For the oyster industry, the risky thing is to do nothing. For others, the introduction is the risky approach.