Download

1 / 49
490 likes | 571 Views
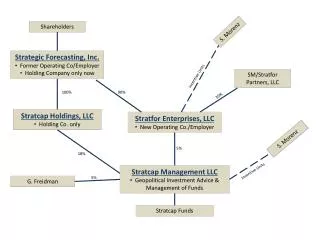
WELCOME SHAREHOLDERS. Lew Hay Chairman and CEO FPL Group, Inc. A Tough Year for Energy Companies (total shareholder return). $100. S&P 500 Electric Utilities Index. (15)%. S&P 500 Multi-Utilities Index. (68)%. 12/31/01. 3/31/02. 6/30/02. 9/30/02. 12/31/02.

E N D
A Tough Year for Energy Companies(total shareholder return) $100 S&P 500 Electric Utilities Index (15)% S&P 500 Multi-Utilities Index (68)% 12/31/01 3/31/02 6/30/02 9/30/02 12/31/02
Total Shareholder Return(12/31/01 – 12/31/02) 11% FPL Group -15% S&P 500 Electric Utilities Index -22% S&P 500 Index
2002 – Another Great Year • Exceeded financial plan • Improved service levels • Continued world-class plant performance
2002 Major Accomplishments: Florida Power & Light • Contributed significantly to FPL Group earnings • Continued strong growth in customers and usage • Lowered rates • Expanded generating capability • Enhanced reliability, customer responsiveness
2002 Major Accomplishments:FPL Energy • Continued disciplined portfolio growth • Extended leadership position in wind • Restructured business to better position for the future
2002 Major Accomplishments:FPL FiberNet • Performed better than peers amidst very difficult marketconditions
3 Major Attributes FPLGROUP Financial Strength Financial Discipline Operational Excellence
Utilizing Quality Tools and Techniques • Ingrained in culture • Renewing focus • Part of continuous improvement efforts
Premier Electric Utility • Strong customer growth • Operational excellence • Proven cost management • Constructive regulatoryenvironment Attractive financial returns
Large and Growing Customer Base • 2.4% increase in customer accounts • 3.5% increase inusage per customer • 10-year annual averages • 2% increase in customer accounts • 1.6% increase in electrical usage • Favorable customer mix Industrial Other Commercial Residential Customer Mix % by revenues
Accommodating Growth • 28% increase in generation over next 10 years • Sanford repoweringand Fort Myers peaking unitsthis year • Martin and Manatee units in 2005
Expanding Infrastructure • Additional delivery systems needed to support continued growth • Urban areas pose biggest challenge • Working closely with customersto help ensure minimal impact
Operational Excellence Nuclear Availability % Fossil Availability %
Important Nuclear Milestones • Turkey Point units approved to operate additional 20 years • St. Lucie extensioncurrently under review by NRC • Nuclear provides nearly one-fourth of FPL generation Turkey Point Plant
Operational ExcellenceService Unavailability(average annual minutes per customer) Good Industry FPL industry source EEI
OSHA Incident Rate DownFPL Power Generation Business Unit(serious injuries per 200,000 hrs. worked) Good
Superior Cost ManagementOperating expenses ($ per customer) Good Industry Average FPL
FPL Residential Rates Low Comparisons of a 1,000 kWh residential bill as of 3/4/03 Rates for FPL, PEF and TECO are effective 4/1/03.
Constructive Regulatory Environment • Classic regulated structure • Incentive-based agreements • Shareholders and customers benefit • Florida a model for other states
Premier Electric Utility • Strong customer growth • Operational excellence • Proven cost management • Constructive regulatoryenvironment Attractive financial returns
Liberty City Tornado
FPL Energy:A Disciplined Wholesale Generator • Low-risk approach • Low-cost provider • World leader in wind generation • Strong asset optimization capability • 7,2741 net MW in operation • presence in 23 states Note: 1 Includes 550 MW of leased capacity at R.I.S.E.P.
Diversified Portfolio at FPL EnergyProjected 2004 (11,5251 net mw inoperation) Regional Diversity Fuel Diversity Gas 60% Northeast Central 26% 36% Wind 20% Other Mid-Atlantic 1% 24% Hydro Nuclear Oil West 3% 9% 7% 14% Note: 1 Includes 550 mw of leased capacity at R.I.S.E.P.
Wind Energy: A Unique Advantage • About 40% U.S. share • Majority of industry’s annual growth achieved by FPL Energy • More than 1,700 net mw in operation today • expect 700-1000 mw more by end of 2003
Why Wind? • Strong construction, operational expertise • Supported by federal and state policy trends • Attractive financial characteristics • long-term power contracts (15 – 25 years) • attractive returns • immediate contributor to earnings • Disciplined development opportunities underway
Significant Contract Coverage Balance of 2003 Available % MW 1 1 Asset Class MW Hedged 2 Wind 1,981 100 2 Other projects / QFs 1,255 98 Merchants 2 Seabrook 9 32 9 2 3 NEPOOL / PJM / NYPP 1, 5 56 5 0 3 ERCOT 2, 657 7 2 3 WECC / SERC 1, 093 3 9 3 Total portfolio 9, 474 7 6 More than 90 percent of expected 2003 gross margin hedged Notes:1 Weighted to reflect in-service dates, planned maintenance, and refueling outage for Seabrook 2 Reflects RTC MW hedged 3 Reflects on-peak MW hedged As of 3/31/03
FPL Energy Business Strategy • Remain a low-cost provider • Selective development, primarily wind • Maintain diversified portfolio • Contract majority of output and hedge fuel requirements • Further optimize portfolio • Consider acquisitions that are accretive, strategically attractive and financeable
2002 Earnings Guidance(presented at 2002 annual meeting) • FPL approximately flat with 2001 • assuming normal weather • FPL Energy up 15% - 20% • reflects modest capacity growth and delay in production tax credits • reflects poor hydro conditions in 1st quarter • assumes no major changes in market prices • Group EPS $4.78 - $4.82
FPL Group 2002 Results EPS Net Income (millions) Includes the cumulative effect of an accounting change at FPL Energy ($222 million after-tax or $1.28 per share), restructuring and other charges at FPL Energy ($73 million after-tax or $0.42 per share), restructuring and impairment charges at Corporate and Other ($64 million after-tax or $0.37 per share), a reserve for leverage leases at Corporate and Other ($30 million after-tax or $0.17 per share), a favorable settlement of litigation with the IRS at Corporate and Other ($30 million after-tax or $0.17 per share) and net unrealized mark-to-market gains associated with non-managed hedges at FPL Energy ($1 million after-tax).
FPL Group 2002 Results: Reconciliation to GAAP Per share In millions $ 2.73 $ 1.28 $(0.17) $ 0.96 - $ 4.80 $ 473 $ 222 $ (30) $ 167 $ (1) $ 831 Net income per GAAP Adjustments: • Adoption of FAS 142 (accounting change) • One-time tax benefit • Restructuring and related charges • Non-managed hedges Adjusted results* * Management views adjusted results as an important indicator of current period operational and economic performance.
Florida Power & Light Results(net income in millions) GAAP Adjusted 1 01 02 01 02 Notes: 1 Includes merger-related expenses ($16 million after tax)
FPL Energy Results (net income in millions) Adjusted GAAP 1 01 02 2 01 02 Notes: 1 Includes net unrealized mark-to-market gains associated with non-managed hedges ($8 million after tax) 2 Includes the cumulative effect of an accounting change ($222 million after tax), restructuring and other charges ($73 million after tax), and net unrealized mark-to-market gains associated with non-managed hedges ($1 million after tax)
Financial Strength • Strong credit ratings re-affirmed in 2002 • Florida Power & Light Aa3 / A • FPL Group Capital A2 / A- • $2.3 billion operating cash flow -- $1.9 billion net of dividends • Issued $1.4 billion equity and equity-linked securities • Credit statistics and ratings well above industry averages
Financial DisciplinePrudent Dividend Policy • Healthy 3.9% yield • Approximately 50% payout ratio expected in 2003 • 4% average growth(1995-2002) Dividends per share
Conservative Risk Management ProfileWell Hedged Position Earnings Contribution %2003 estimated1 • Fuel clause mitigates commodity price fluctuations • Geographic diversity • Fuel/technology diversity • Well-hedged portfolio Florida Power & Light FPLEnergy Corporate & Other 1 Excludes mark-to-market effect of non-managed hedges, which cannot be determined at this time
Outlook for 2003 Remains Strong • FPL • expect $725 - $735 million net income in 2003 assuming normal weather • FPL Energy • expect 2003 earnings of $165 - $190 million1 • Corporate and Other • breakeven results at FPL FiberNet • higher interest expense • net drag of 20 - 30 cents per share Expect EPS of $4.80 to $5.001 1 Excluding the effect of non-managed hedges which cannot be determined at this time.
First Quarter Strong Performance Adjusted GAAP EPS EPS Net Income (millions) Net Income (millions) $172 $175 $0.99 $0.97 $0.80 $135 02 02 03 03 $(56) $(0.33) 02 02 03 03 2003 results include a net unrealized mark-to-market gain of $3 million after-tax or $0.02 per share associated with non-managed hedges, primarily at FPL Energy. 2002 results include an impairment loss of $222 million after-tax or $1.31 per share at FPL Energy, a net unrealized mark-to-market gain of $1 million after-tax associated with non-managed hedges at FPL Energy and a favorable IRS settlement of $30 million or $0.18 per share at Corporate and Other.
FPL Group: A Solid Investment • Built on solid fundamentals • Proven track record • Attractive, realistic growth prospects • Relatively low-risk profile • Ongoing commitment to excellent corporate governance
Toward Another Great Year in 2003 • Committed to financial strength and discipline, operational excellence • Steady growth and strong operating performance at FPL • Continued disciplined growth at FPL Energy