Download
1 / 22
220 likes | 412 Views
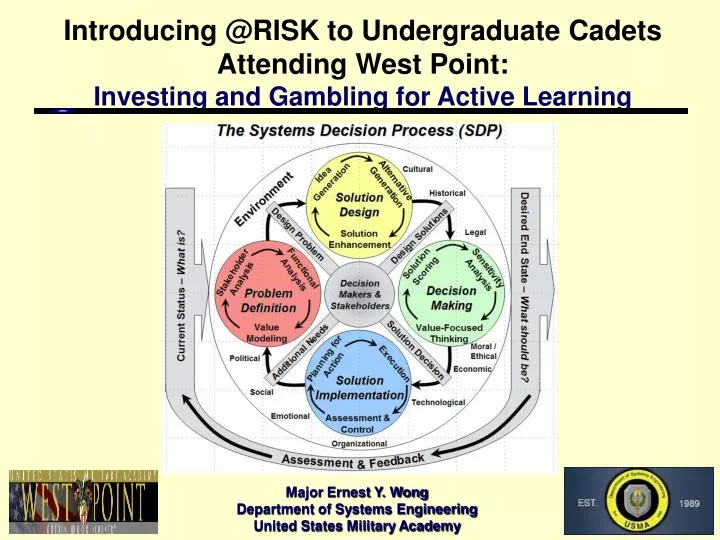
Introducing @RISK to Undergraduate Cadets Attending West Point: Investing and Gambling for Active Learning. Major Ernest Y. Wong Department of Systems Engineering United States Military Academy. Agenda. Goals of SE350, Systems Modeling and Design Active Learning through Simulations

E N D
Introducing @RISK to Undergraduate Cadets Attending West Point:Investing and Gambling for Active Learning Major Ernest Y. Wong Department of Systems Engineering United States Military Academy
Agenda • Goals of SE350, Systems Modeling and Design • Active Learning through Simulations • Kolb’s Experiential Learning Model (investment case study) • Experience • Observe • Generalize • Test • Promoting Bloom’s Taxonomy of Cognitive Learning • Challenges in Teaching Simulation • Student Feedback • Conclusions
Goals of SE350, Systems Modeling and Design Core Engineering Sequence Learning Model Overview Crawl Walk Run Methods Course SE350 Introductory Course SE300 Design Course SE450
Goals of SE350, Systems Modeling and Design Core Engineering Sequence Learning Model Overview Crawl Walk Run Methods Course SE350 Introductory Course SE300 Design Course SE450 • Introduces non-Engineering majors to a systematic problem solving framework • Acquaints undergraduate students to engineering concepts and terminology • --Stakeholder Analysis • --Problem Definition • --Value Hierarchy • --Alternative Generation • --Cost Benefit Analysis • --Pareto Principle • --Functional Decomposition • --Assessment & Control
Goals of SE350, Systems Modeling and Design Core Engineering Sequence Learning Model Overview Crawl Walk Run Methods Course SE350 Introductory Course SE300 Design Course SE450 • Builds upon the mathematics and basic science concepts learned in • the undergraduate core curriculum • Introduces non-Engineering majors to various quantitative • methods • Focuses on the application of economic, deterministic, and stochastic • models
Goals of SE350, Systems Modeling and Design Core Engineering Sequence Learning Model Overview Crawl Walk Run Methods Course SE350 Introductory Course SE300 Design Course SE450 • Develops student teams capable of helping satisfy client needs and proposing solutions to actual problems • --West Point Cemetery • --Army/Navy Game Site • --Cadet Summer Training • --Cadet Ethics Training • --Post 9/11 Traffic Flow • --Army UAV Cmd & Cntl • --Soldier Pre-Deployment Tng
Goals of SE350, Systems Modeling and Design Core Engineering Sequence Learning Model Overview Crawl Walk Run Methods Course SE350 Introductory Course SE300 Design Course SE450 • Builds upon the mathematics and basic science concepts learned in • the undergraduate core curriculum • Introduces non-Engineering majors to various quantitative • methods • Focuses on the application of economic, deterministic, and stochastic • models • --Decision Analysis (Risk and Uncertainty) • --Engineering Economy (Time Value of Money) • --Optimization Techniques • --Forecasting • --Spreadsheet Modeling • --Monte Carlo Simulation
“RISKLESS” ASSETS PARAMETERS Mean = 3.00% Mean = 3.60% Mean = 5.20% Min = -0.26% Max = 12.27% Mean = 2.31% Stdv = 3.00% Mean = 10.68% Stdv = 4.00% Mean = 4.65% Stdv = 5.00% Mean = 5.90% Stdv = 6.00% Mean = 11.08% Stdv = 10.00% Mean = 4.26% Stdv = 10.00% Mean = 18.02% Stdv = 11.00% Mean = 5.62% Stdv = 12.00% Mean = 9.60% Stdv = 14.35% Mean = 23.07% Stdv = 15.25% Mean = 15.76% Stdv = 16.00% Mean = 9.10% Stdv = 18.00% Mean = 18.00% Stdv = 19.00% Mean = 5.24% Stdv = 21.00% Mean = 19.70% Stdv = 33.00% Mean = 11.20% Stdv = 45.00% Mean = 22.60% Stdv = 84.61% Mean = 42.60% Stdv =209.00% Min = -50.00% Mean = 20.00% Max = 150.00% Min = -100.00% Mean = 50.00% Max = 300.00% “MODERATELY RISKY” ASSETS “RISKY” ASSETS Student Investment Ideas (1. Experience) BEST FITTING DISTRIBUTION Constant Constant Constant Uniform Normal Normal Normal Normal Normal Normal Normal Normal Normal Normal Normal Normal Normal Normal Normal Normal Normal Normal Triangular Triangular 1. ING Savings Account 2. Edward Jones INDYMAC CD 3. USAA 104-Month CD 4. Fidelity Ginnie Mae Fund 5. Oppenheimer Int’l Bond 6. Dodge & Cox Balanced 7. Vanguard Target Retirement 2045 8. Franklin Templeton Founding 9. Fairholme Fund 10. USAA Cornerstone Strategy 11. Aegis Value 12. Vanguard Wellington 13. USAA S&P 500 14. Vanguard Energy Admiral 15. Vanguard Healthcare 16. Prudent Bear 17. Cohen & Stears Realty 18. USAA Extended Market 19. Wal-Mart 20. Pepsico 21. Starbucks Coffee 22. Advanced Micro Devices 23. Miami, Florida Real Estate 24. Poker
Focusing on Starbucks Coffee (2. Observe) Normal Distribution Mean = 22.60% Stdv = 84.61% Although we can expect to earn a 22.60% annual return on SBUX, what is the probability that we lose money on the stock? Would you invest $24,000 of your own money in SBUX?
“RISKLESS” ASSETS 1. ING Savings Account 2. Edward Jones INDYMAC CD 3. USAA 104-Month CD 4. Fidelity Ginnie Mae Fund 5. Oppenheimer Int’l Bond 6. Dodge & Cox Balanced 7. Vanguard Target Retirement 2045 8. Franklin Templeton Founding 9. Fairholme Fund 10. USAA Cornerstone Strategy 11. Aegis Value 12. Vanguard Wellington 13. USAA S&P 500 14. Vanguard Energy Admiral 15. Vanguard Healthcare 16. Prudent Bear 17. Cohen & Stears Realty 18. USAA Extended Market 19. Wal-Mart 20. Pepsico 21. Starbucks Coffee 22. Advanced Micro Devices 23. Miami, Florida Real Estate 24. Poker “MODERATELY RISKY” ASSETS “RISKY” ASSETS Simulate a Portfolio of All 24 Ideas (2. Observe) Wouldn’t you rather invest $1000 into each asset and accept an expected annual gain of 17.53% (vs. 22.6%) with just a 7.29% chance of losing money (vs. 39.5%)!?!
+ + The Central Limit Theorem (3. Generalize) The Central Limit Theorem tells us that if enough independent samples of almost any distribution are averaged together, the resulting distribution is normal.
“RISKLESS” ASSETS PARAMETERS Mean = 3.00% Mean = 3.60% Mean = 5.20% Min = -0.26% Max = 12.27% Mean = 2.31% Stdv = 3.00% Mean = 10.68% Stdv = 4.00% Mean = 4.65% Stdv = 5.00% Mean = 5.90% Stdv = 6.00% Mean = 11.08% Stdv = 10.00% Mean = 4.26% Stdv = 10.00% Mean = 18.02% Stdv = 11.00% Mean = 5.62% Stdv = 12.00% Mean = 9.60% Stdv = 14.35% Mean = 23.07% Stdv = 15.25% Mean = 15.76% Stdv = 16.00% Mean = 9.10% Stdv = 18.00% Mean = 18.00% Stdv = 19.00% Mean = 5.24% Stdv = 21.00% Mean = 19.70% Stdv = 33.00% Mean = 11.20% Stdv = 45.00% Mean = 22.60% Stdv = 84.61% Mean = 42.60% Stdv =209.00% Min = -50.00% Mean = 20.00% Max = 150.00% Min = -100.00% Mean = 50.00% Max = 300.00% “MODERATELY RISKY” ASSETS “RISKY” ASSETS Student Investment Ideas (4. Test) BEST FITTING DISTRIBUTION Constant Constant Constant Uniform Normal Normal Normal Normal Normal Normal Normal Normal Normal Normal Normal Normal Normal Normal Normal Normal Normal Normal Triangular Triangular 1. ING Savings Account 2. Edward Jones INDYMAC CD 3. USAA 104-Month CD 4. Fidelity Ginnie Mae Fund 5. Oppenheimer Int’l Bond 6. Dodge & Cox Balanced 7. Vanguard Target Retirement 2045 8. Franklin Templeton Founding 9. Fairholme Fund 10. USAA Cornerstone Strategy 11. Aegis Value 12. Vanguard Wellington 13. USAA S&P 500 14. Vanguard Energy Admiral 15. Vanguard Healthcare 16. Prudent Bear 17. Cohen & Stears Realty 18. USAA Extended Market 19. Wal-Mart 20. Pepsico 21. Starbucks Coffee 22. Advanced Micro Devices 23. Miami, Florida Real Estate 24. Poker
x Yet when we make 12 separate purchases into AMD, does it make sense that the chance of losing money falls to 27%? Distribution for 12 $2000 Investments into AMD/E15 0 0 0 0 0.700 Mean=0.4259027 Mean=0.4259027 Mean=0.4259027 0.600 0.500 @RISK Student Version 0.400 For Academic Use Only 0.300 Distribution for 24 $1000 Investments into 0.200 AMD/I24 0 0 0 0 0.100 1.000 Mean=0.4256299 Mean=0.4256299 Mean=0.4256299 0.000 0.900 -1.5 -1.5 -0.375 -0.375 0.75 0.75 1.875 1.875 3 3 x 0.800 0.700 27.28% 67.72% 5% @RISK Student Version 0.600 1.434 0 0.500 For Academic Use Only We are still investing $24,000 but chance of losing money now drops to 18%. 0.400 0.300 0.200 0.100 0.000 -1.5 -1.5 -0.625 -0.625 0.25 0.25 1.125 1.125 2 2 17.77% 77.23% 5% The Central Limit Theorem states that if enough independent samples of almost any distribution are averaged together, the resulting distribution is normal. 0 1.2098 Re-Examining Modeling Assumptions (4. Test) Advanced Micro Devices (AMD) Normal Dist. Mean = 42.60% Stdv =209.00% Has about a 42% chance of losing money.
Level 2 Goals Level 1 Goals Bloom’s Taxonomy on Cognitive Learning
Approach in SE350--Systems Modeling & Design 1. Experience: Student investment ideas (ownership of familiar concepts) 2. Observe: Understanding histograms (application of familiar concepts) 3. Generalize: Investment diversification (progression to new concepts) 4. Test: Modeling assumptions (understanding of modeling limitations, risks, and tradeoffs)
Students Insights into Modeling with @RISK • Is there such a thing as “riskless” investments? • What data should be used to try to determine a best fitting distribution? • Which idealized distributions are indeed best from BestFit? • What about modeling distributions with infinite tails? How realistic is this?
Challenges in Advancing Up Bloom’s Steps However, some students complained that they: • Did not feel that they were equipped with adequate knowledge to interpret the simulation results (KnowledgeRecall) • Did not know what actions to take to improve system performance (UnderstandingGrasp) • Focused mainly on the mechanics of building the simulation model and believed the problem was solved once they ran the simulation (ApplicationApply) • Found it difficult to go beyond just providing a single “optimal” solution (AnalysisAnalyze) • Expressed unease with having to deal with uncertainties and coming up with open-ended recommendations (Synthesis & EvaluationSynthesize & Judge)
Positive Student Feedback • “I see a lot of potential for Excel.” • “I thought the projects were very applicable.” • “I liked learning how to use the simulation models.” • “I really liked the systems modeling and design portion of the course—it was straight-forward and applicable.” • “I liked the projects; they gave me a chance to actually figure out which course of action to take instead of me knowing exactly which decision making process to use.” • “I wish I had more of these projects.” • “I wish I had majored in Systems Engineering instead of xxxxxxxx.” I hear, I forget. I see, I remember. I do, I understand. --Chinese Proverb
Goal of Systems Engineering at USMA “We are preparing graduates who are scientifically literate and capable of applying mathematical, engineering, and computational modes of thought to the solution of complex problems.” --Dean, United States Military Academy
Questions? ernest.wong@usma.edu