Download
1 / 1
10 likes | 111 Views
APL 600 BID, n= 58. APL 600 BID, n= 58. APL 800 BID, n=58. APL 800 BID, n=58. COM/EFV, n=29. COM/EFV, n=29. 100. 100. 90. 90. 80. 80. 70. 70. 60. 60. 50. 50. 40. 40. 30. 30. 20. 20. 10. 10. 0. 0. Introduction.

E N D
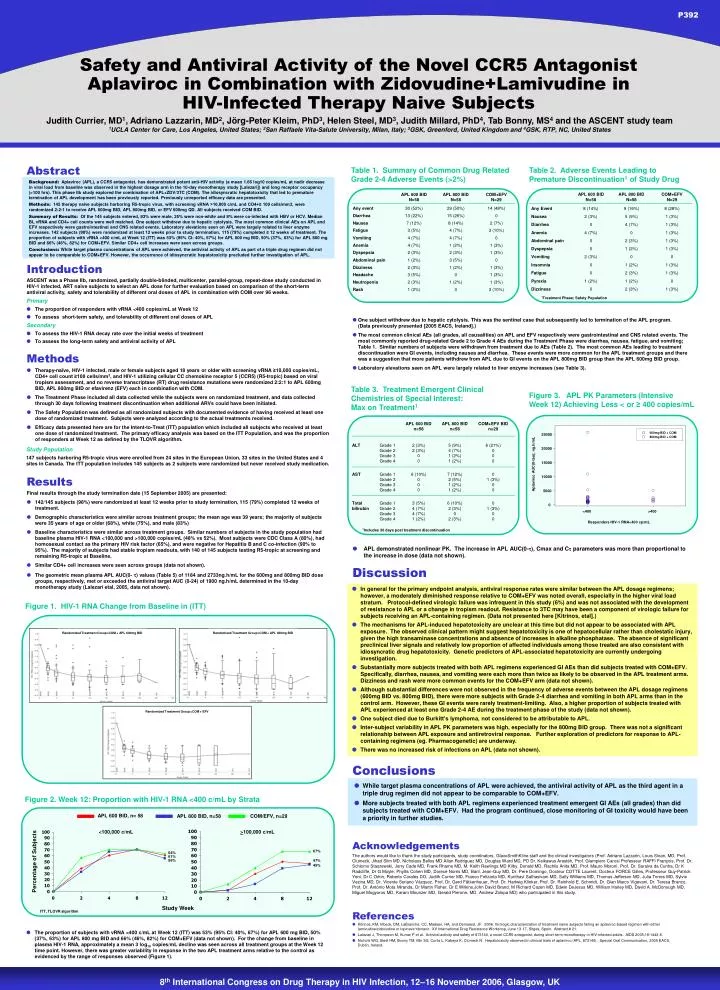
APL 600 BID, n= 58 APL 600 BID, n= 58 APL 800 BID, n=58 APL 800 BID, n=58 COM/EFV, n=29 COM/EFV, n=29 100 100 90 90 80 80 70 70 60 60 50 50 40 40 30 30 20 20 10 10 0 0 Introduction ASCENT was a Phase IIb, randomized, partially double-blinded, multicenter, parallel-group, repeat-dose study conducted in HIV-1 infected, ART naïve subjects to select an APL dose for further evaluation based on comparison of the short-term antiviral activity, safety and tolerability of different oral doses of APL in combination with COM over 96 weeks. Primary • The proportion of responders with vRNA <400 copies/mL at Week 12 • To assess short-term safety, and tolerability of different oral doses of APL Secondary • To assess the HIV-1 RNA decay rate over the initial weeks of treatment • To assess the long-term safety and antiviral activity of APL Figure 1. ASCENT (CCR102881) Study Design GW873140 (600mg BID) + placebo (BID) +ZDV/3TC (BID) Methods GW873140 (600mg OR 800mg BID) + ZDV/3TC (BID) • Therapy-naïve, HIV-1 infected, male or female subjects aged 18 years or older with screening vRNA ≥10,000 copies/mL, CD4+ cell count ≥100 cells/mm3, and HIV-1 utilizing cellular CC chemokine receptor 5 (CCR5) (R5-tropic) based on viral tropism assessment, and no reverse transcriptase (RT) drug resistance mutations were randomized 2:2:1 to APL 600mg BID, APL 800mg BID or efavirenz (EFV) each in combination with COM. • The Treatment Phase included all data collected while the subjects were on randomized treatment, and data collected through 30 days following treatment discontinuation when additional ARVs could have been initiated. • The Safety Population was defined as all randomized subjects with documented evidence of having received at least one dose of randomized treatment. Subjects were analyzed according to the actual treatments received. • Efficacy data presented here are for the Intent-to-Treat (ITT) population which included all subjects who received at least one dose of randomized treatment. The primary efficacy analysis was based on the ITT Population, and was the proportion of responders at Week 12 as defined by the TLOVR algorithm. Screening GW873140 (800mg BID) + ZDV/3TC (BID) Efavirenz (QD) + ZDV/3TC (BID) Efavirenz (QD) +ZDV/3TC (BID) 600mg BID + COM Virological failures (all cohorts): “on study/off drug” phase of trial 800mg BID + COM Randomised Phase (Day 1 - Week 48) Non-Randomised Phase (through Week 96 or Withdrawal/Follow-up) Study Population 147 subjects harboring R5-tropic virus were enrolled from 24 sites in the European Union, 33 sites in the United States and 4 sites in Canada. The ITT population includes 145 subjects as 2 subjects were randomized but never received study medication. Results Final results through the study termination date (15 September 2005) are presented: • 142/145 subjects (98%) were randomized at least 12 weeks prior to study termination, 115 (79%) completed 12 weeks of treatment. • Demographic characteristics were similar across treatment groups; the mean age was 39 years; the majority of subjects were 35 years of age or older (68%), white (75%), and male (83%) • Baseline characteristics were similar across treatment groups. Similar numbers of subjects in the study population had baseline plasma HIV-1 RNA <100,000 and >100,000 copies/mL (48% vs 52%). Most subjects were CDC Class A (80%), had homosexual contact as the primary HIV risk factor (65%), and were negative for Hepatitis B and C co-infection (90% to 95%). The majority of subjects had stable tropism readouts, with 140 of 145 subjects testing R5-tropic at screening and remaining R5-tropic at Baseline. • Similar CD4+ cell increases were seen across groups (data not shown). • The geometric mean plasma APL AUC(0- ) values (Table 5) of 1184 and 2733ng.h/mL for the 600mg and 800mg BID dose groups, respectively, met or exceeded the antiviral target AUC (0-24) of 1900 ng.h/mL determined in the 10-day monotherapy study (Lalezari etal, 2005, data not shown). Randomized Treatment Group=COM + APL 600mg BID Randomized Treatment Group=COM + APL 800mg BID Randomized Treatment Group=COM + EFV <100,000 c/mL >100,000 c/mL 67% 47% 45% 64% 61% 56% 2 4 8 12 2 4 8 12 P392 Safety and Antiviral Activity of the Novel CCR5 Antagonist Aplaviroc in Combination with Zidovudine+Lamivudine in HIV-Infected Therapy Naive Subjects Judith Currier, MD1, Adriano Lazzarin, MD2, Jörg-Peter Kleim, PhD3, Helen Steel, MD3, Judith Millard, PhD4, Tab Bonny, MS4 and the ASCENT study team1UCLA Center for Care, Los Angeles, United States; 2San Raffaele Vita-Salute University, Milan, Italy; 3GSK, Greenford, United Kingdom and 4GSK, RTP, NC, United States Abstract Table 1. Summary of Common Drug Related Grade 2-4 Adverse Events (>2%) Table 2. Adverse Events Leading to Premature Discontinuation1 of Study Drug Background: Aplaviroc (APL), a CCR5 antagonist, has demonstrated potent anti-HIV activity (a mean 1.66 log10 copies/mL at nadir decrease in viral load from baseline was observed in the highest dosage arm in the 10-day monotherapy study [Lalezari]) and long receptor occupancy (>100 hrs). This phase IIb study explored the combination of APL+ZDV/3TC (COM). The idiosyncratic hepatotoxicity that led to premature termination of APL development has been previously reported. Previously unreported efficacy data are presented. Methods: 145 therapy naive subjects harboring R5-tropic virus, with screening vRNA >10,000 c/mL and CD4+≥ 100 cells/mm3, were randomized 2:2:1 to receive APL 600mg BID, APL 800mg BID, or EFV 600mg QD. All subjects received COM BID. Summary of Results: Of the 145 subjects entered, 83% were male, 25% were non-white and 8% were co-infected with HBV or HCV. Median BL vRNA and CD4+ cell counts were well matched. One subject withdrew due to hepatic cytolysis. The most common clinical AEs on APL and EFV respectively were gastrointestinal and CNS related events. Laboratory elevations seen on APL were largely related to liver enzyme increases. 142 subjects (98%) were randomized at least 12 weeks prior to study termination, 115 (79%) completed ≥ 12 weeks of treatment. The proportion of subjects with vRNA <400 c/mL at Week 12 (ITT) was 53% (95% CI: 40%, 67%) for APL 600 mg BID, 50% (37%, 63%) for APL 800 mg BID and 66% (46%, 82%) for COM+EFV. Similar CD4+ cell increases were seen across groups. Conclusions: While target plasma concentrations of APL were achieved, the antiviral activity of APL as part of a triple drug regimen did not appear to be comparable to COM+EFV. However, the occurrence of idiosyncratic hepatotoxicity precluded further investigation of APL. 1Treatment Phase; Safety Population • One subject withdrew due to hepatic cytolysis. This was the sentinel case that subsequently led to termination of the APL program. (Data previously presented [2005 EACS, Ireland].) • The most common clinical AEs (all grades, all causalities) on APL and EFV respectively were gastrointestinal and CNS related events. The most commonly reported drug-related Grade 2 to Grade 4 AEs during the Treatment Phase were diarrhea, nausea, fatigue, and vomiting; Table 1. Similar numbers of subjects were withdrawn from treatment due to AEs (Table 2). The most common AEs leading to treatment discontinuation were GI events, including nausea and diarrhea. These events were more common for the APL treatment groups and there was a suggestion that more patients withdrew from APL due to GI events on the APL 800mg BID group than the APL 600mg BID group. • Laboratory elevations seen on APL were largely related to liver enzyme increases (see Table 3). Table 3. Treatment Emergent Clinical Chemistries of Special Interest: Max on Treatment1 Figure 3. APL PK Parameters (Intensive Week 12) Achieving Less < or ≥ 400 copies/mL 25000 20000 15000 Aplaviroc AUC(0-tau); ng.h/mL 10000 5000 0 <400 >400 Responders HIV-1 RNA<400 cp/mL 1n=12 1Includes 30 days post treatment discontinuation • APL demonstrated nonlinear PK. The increase in APL AUC(0-), Cmax and C parameters was more than proportional to the increase in dose (data not shown). Figure 1. Demographic and Baseline Characteristics Discussion • In general for the primary endpoint analysis, antiviral response rates were similar between the APL dosage regimens; however, a moderately diminished response relative to COM+EFV was noted overall, especially in the higher viral load stratum. Protocol-defined virologic failure was infrequent in this study (6%) and was not associated with the development of resistance to APL or a change in tropism readout. Resistance to 3TC may have been a component of virologic failure for subjects receiving an APL-containing regimen. (Data not presented here [Kitrinos, etal].) • The mechanisms for APL-induced hepatotoxicity are unclear at this time but did not appear to be associated with APL exposure. The observed clinical pattern might suggest hepatotoxicity is one of hepatocellular rather than cholestatic injury, given the high transaminase concentrations and absence of increases in alkaline phosphatase. The absence of significant preclinical liver signals and relatively low proportion of affected individuals among those treated are also consistent with idiosyncratic drug hepatotoxicity. Genetic predictors of APL-associated hepatotoxicity are currently undergoing investigation. • Substantially more subjects treated with both APL regimens experienced GI AEs than did subjects treated with COM+EFV. Specifically, diarrhea, nausea, and vomiting were each more than twice as likely to be observed in the APL treatment arms. Dizziness and rash were more common events for the COM+EFV arm (data not shown). • Although substantial differences were not observed in the frequency of adverse events between the APL dosage regimens (600mg BID vs. 800mg BID), there were more subjects with Grade 2-4 diarrhea and vomiting in both APL arms than in the control arm. However, these GI events were rarely treatment-limiting. Also, a higher proportion of subjects treated with APL experienced at least one Grade 2-4 AE during the treatment phase of the study (data not shown). • One subject died due to Burkitt’s lymphoma, not considered to be attributable to APL. • Inter-subject variability in APL PK parameters was high, especially for the 800mg BID group. There was not a significant relationship between APL exposure and antiretroviral response. Further exploration of predictors for response to APL-containing regimens (eg. Pharmacogenetic) are underway. • There was no increased risk of infections on APL (data not shown). Figure 1. HIV-1 RNA Change from Baseline in (ITT) Conclusions • While target plasma concentrations of APL were achieved, the antiviral activity of APL as the third agent in a triple drug regimen did not appear to be comparable to COM+EFV. • More subjects treated with both APL regimens experienced treatment emergent GI AEs (all grades) than did subjects treated with COM+EFV. Had the program continued, close monitoring of GI toxicity would have been a priority in further studies. Figure 2. Week 12: Proportion with HIV-1 RNA <400 c/mL by Strata <100,000 c/mL >100,000 c/mL Acknowledgements 67% 47% 45% 64% 61% 56% The authors would like to thank the study participants, study coordinators, GlaxoSmithKline staff and the clinical investigators (Prof. Adriano Lazzarin, Louis Sloan, MD, Prof. Clumeck, Jihad Slim MD, Nicholaos Bellos MD Allan Rodriguez MD, Douglas Ward MD, PD Dr. Keikawus Arastéh, Prof. Giampiero Carosi Professeur RAFFI François, Prof. Dr. Schlomo Staszewski, Jerry Cade MD, Frank Rhame MD, M. Keith Rawlings MD Kilby, Donald MD, Rachlis Anita MD, Prof. Mauro Moroni, Prof. Dr. Saraiva da Cunha, Dr K Radcliffe, Dr G Moyle, Phyllis Cohen MD, Dorece Norris MD, Baril, Jean-Guy MD, Dr. Pere Domingo, Docteur COTTE Laurent, Docteur FORCE Gilles, Professeur Guy-Patrick Yeni, Dr C Orkin, Roberto Corales DO, Judith Currier MD, Franco Felizarta MD, Kunthavi Sathasivam MD, Sally Williams MD, Thomas Jefferson MD, Julia Torres MD, Sylvie Vezina MD, Dr. Vicente Soriano Vázquez, Prof. Dr. Gerd Fätkenheuer, Prof. Dr. Hartwig Klinker, Prof. Dr. Reinhold E. Schmidt, Dr. Gian Marco Vigevani, Dr. Teresa Branco, Prof. Dr. António Mota Miranda, Dr Martin Fisher, Dr E Wilkins,John David Brand, M Richard Cazen MD, Edwin DeJesus MD, William Harley MD, David A. McDonough MD, Miguel Mogyoros MD, Karam Mounzer MD, Gerald Pierone, MD, Andrew Zolopa MD) who participated in this study. Percentage of Subjects Percentage of Subjects Study Week Study Week ITT, TLOVR algorithm ITT, TLOVR algorithm References • Kitrinos, KM, Irlbeck, DM, LaBranche, CC, Madsen, HA, and Demarest, JF. 2006. Virologic characterization of treatment naive subjects failing an aplaviroc-based regimen with either lamivudine/zidovudine or lopinavir/ritonavir. XV International Drug Resistance Workshop, June 13-17, Sitges, Spain. Abstract # 21. • Lalezari J, Thompson M, Kumar P et al. Antiviral activity and safety of 873140, a novel CCR5 antagonist, during short-term monotherapy in HIV-infected adults. AIDS 2005;19:1443-8. • Nichols WG, Steel HM, Bonny TM, Min SS, Curtis L, Kabeya K, Clumeck N. Hepatotoxicity observed in clinical trials of aplaviroc (APL, 873140). Special Oral Communication, 2005 EACS, Dublin, Ireland. • The proportion of subjects with vRNA <400 c/mL at Week 12 (ITT) was 53% (95% CI: 40%, 67%) for APL 600 mg BID, 50% (37%, 63%) for APL 800 mg BID and 66% (46%, 82%) for COM+EFV (data not shown). For the change from baseline in plasma HIV-1 RNA, approximately a mean 3 log10 copies/mL decline was seen across all treatment groups at the Week 12 time point. However, there was greater variability in response in the two APL treatment arms relative to the control as evidenced by the range of responses observed (Figure 1).