Download
1 / 1
10 likes | 111 Views
Supplemental Fig. 1 Live and dead cells estimated by trypan blue cell viability assay in 6-well plates. A. Experiment 1. A’. Experiment 2. d8. d6. d7. d4. d8. d1. d4. d2. d3. Live cells number (x10000). Live cells number (x10000). d1. *. *. *. *. *. *. *. *.

E N D
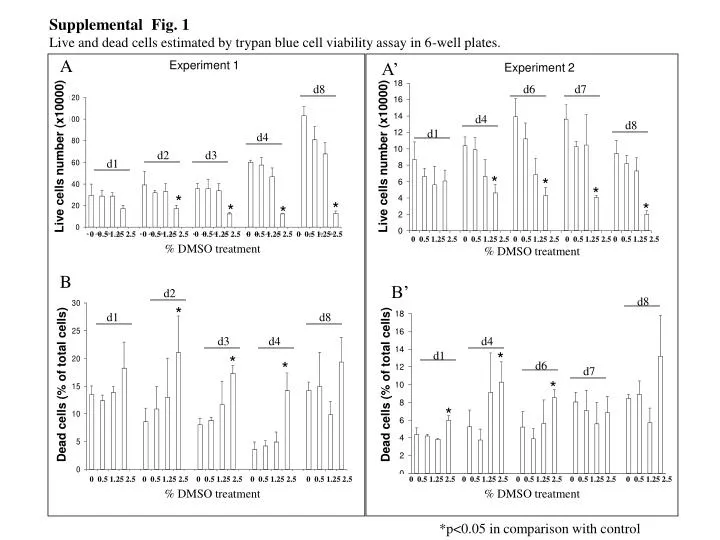
Supplemental Fig. 1 Live and dead cells estimated by trypan blue cell viability assay in 6-well plates. A Experiment 1 A’ Experiment 2 d8 d6 d7 d4 d8 d1 d4 d2 d3 Live cells number (x10000) Live cells number (x10000) d1 * * * * * * * * 0 0.5 1.25 2.50 0.5 1.25 2.50 0.5 1.25 2.5 0 0.5 1.25 2.5 0 0.5 1.25 2.5 % DMSO treatment 0 0.5 1.25 2.50 0.5 1.25 2.50 0.5 1.25 2.5 0 0.5 1.25 2.50 0.5 1.25 2.5 % DMSO treatment B B’ d2 d8 * d1 d8 d3 d4 d4 * d1 * * d6 d7 * Dead cells (% of total cells) Dead cells (% of total cells) * *p<0.05 in comparison with control 0 0.5 1.25 2.50 0.5 1.25 2.50 0.5 1.25 2.5 0 0.5 1.25 2.5 0 0.5 1.25 2.5 % DMSO treatment 0 0.5 1.25 2.50 0.5 1.25 2.50 0.5 1.25 2.5 0 0.5 1.25 2.5 0 0.5 1.25 2.5 % DMSO treatment *p<0.05 in comparison with control