Download
1 / 4
40 likes | 131 Views
ITS/CVO Architecture Conformance: Interoperability Testing Strategy Table of Contents. 1 Introduction 2 Terminology 3 Scope 4 Roles and Responsibilities 5 Test Environment and Tools 6 Test Process 7 Key Criteria Appendix A Level 1 Interoperability Test Matrix

E N D
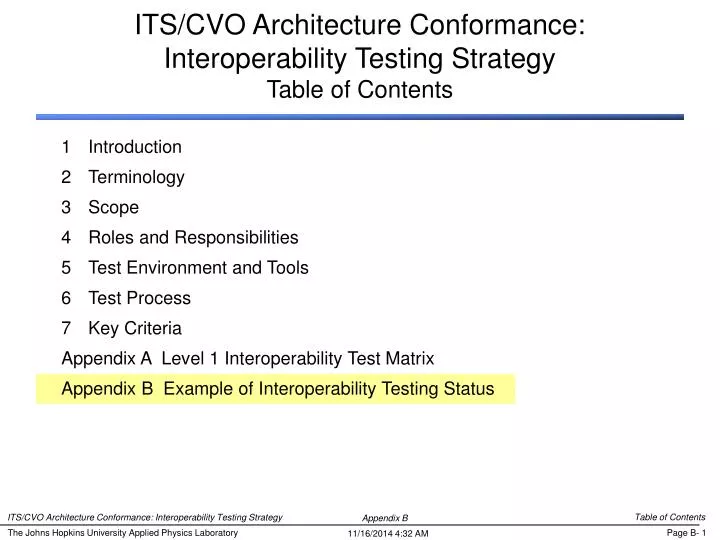
ITS/CVO Architecture Conformance:Interoperability Testing StrategyTable of Contents 1 Introduction 2 Terminology 3 Scope 4 Roles and Responsibilities 5 Test Environment and Tools 6 Test Process 7 Key Criteria Appendix A Level 1 Interoperability Test Matrix Appendix B Example of Interoperability Testing Status Table of Contents The Johns Hopkins University Applied Physics Laboratory
APL Interoperability Test Summary Chart - Example White cell shows date that test could be run, and number of test cases attempted so far. Level 1 If cell turns green (shaded), then all test cases have run successfully by that date. Example Set 1: Tests developed in next version (Jun ‘99) of Test Suite - run tests at least in facility by Aug ‘99 Set 2: Tests developed in next version (Oct ‘99) version and run at least in facility by Feb ‘00 Test Summary Chart - Example The Johns Hopkins University Applied Physics Laboratory
Set 1: 19 scenarios that exercise 77 test cases! 15 test cases attempted! APL Interoperability Test Summary Chart - Example Level 1 Test Summary Chart - Example The Johns Hopkins University Applied Physics Laboratory