Download
1 / 40
400 likes | 517 Views
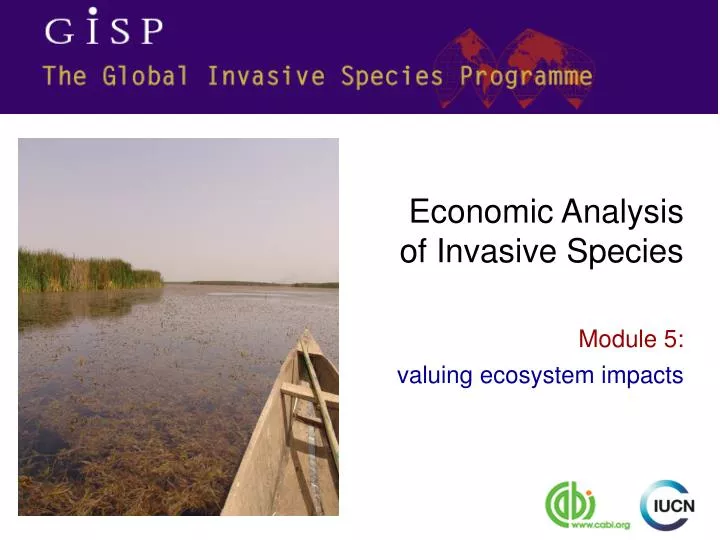
Economic Analysis of Invasive Species. Module 5: valuing ecosystem impacts. what this module covers. commonly-used ecosystem valuation techniques their application to invasive species the limitations of economic valuation. about invasive species. Module 1.

E N D
Economic Analysisof Invasive Species Module 5: valuing ecosystem impacts
what this module covers • commonly-used ecosystem valuation techniques • their application to invasive species • the limitations of economic valuation about invasive species Module 1 understanding the economic causes of invasions Module 2 impacts of invasive species and ways to address them Module 3 defining invasive-relatedcosts & benefits Module 4 valuing ecosystem impacts Module 5 informing actionsto address invasives Module 6
market prices looks at the market price of ecosystem goods and services how much they cost to buy or what they are worth to sell
market prices are particularly useful for valuing the resources and products that are harvested directly from ecosystems • direct on-site impacts on marketed goods: • when invasive species replace other species which yield marketed products or resources (for example crops, livestock products, timber or fish) • when invasive species themselves yield marketed products or resources (for example crops, biofuels, livestock products, timber or fish)
market prices local use of wetland resources in Southern Africa • 10 wetlands on Zambezi River (Angola, Zambia, Botswana, Namibia, Zimbabwe, Malawi, Mozambique) • carried out inventory of economically valuable wetland products • local market survey conducted to find out prices for different products • user survey identified levels and quantities of use • crops, livestock, fish, tourism, fuel, handicrafts, construction materials, medicines, wild foods worth $145 million/yr or $48/ha (Seyam et al 2001)
going beyond market prices • the reason why policy, market and price distortions and failures result in invasions is because prices and markets send the wrong signals to producers and consumers about the “real” costs and benefits of their actions • many ecosystem goods and services do not have markets • many ecosystem goods and services are subject to markets which are highly distorted or irregular • in such cases, alternative valuation techniques must be applied which do not rely on uncorrected market prices
stated preference methods revealed preference methods marketprices production function approaches surrogate market approaches cost-based approaches marketprices effect on production travelcosts replacementcosts contingent valuation hedonicpricing mitigative & avertive expenditures damagecosts avoided summary of valuation methods
effect on production relate changes in the output of a marketed goodor service to a measurable change in the quality of quantity of ecosystem goods and services the value of ecosystem services as inputs to production
effect on production can be used to look at the changes in output that occur when invasive species impact on the provision of particular goods and services which are required for offsite or downstream production • When invasive species: • replace other species which yield marketed products or resources which are used as inputs for other production processes, such as natural pesticides or pollinators, or raw materials • interfere with natural habitat for species which are commercially important offsite such as bird and fisheries breeding and habitat • introduce human, plant or animal diseases and pests • interfere with or choke water supplies which are required for downstream irrigation, fisheries, hydropower or urban water supplies • lead to changes in soil fertility, or soil erosion
1 determine the contribution of ecosystem goods and services to the related source of production 2 specify the relationship between changes in the quality or quantity of a particular ecosystem good or service and output 3 relate a specified change in the provision of the ecosystem good or service to a physical change in the output or availability of the related product 4 estimate the market value of the change in production effect on production
effect on production global agricultural costs of pollinator decline • looks at 100 food crops which depend on insects for pollination • used dependence ratios quantifying impact lack of insect pollinators on crop value • constructed bioeconomic models using reduction in yield, quantity produced and consumed, dependence ratio, retail price • total economic value of insect pollination €153 billion or 9.4% of total production value (Gallai et al 2007)
travel costs look at the ways in which the value of ecosystem goods and services are reflected indirectly in people’s expenditures on travel the value of ecosystems as recreational or leisure destinations
travel costs can be used to look at the changes in tourism and recreational earnings which occur when invasive species make a site less or more attractive to visitors • When : • the habitats being invaded are used for recreational purposes such as hiking, camping, fishing, boating or are considered to have particular landscape beauty, which is compromised by the presence of invasive species
1 ascertain the total area from which recreational visitors come to visit an ecosystem, and divide this into zones within which travel costs are approximately equal 2 within each zone, sample visitors to collect information about costs incurred in visiting the ecosystem, motives for the trip, frequency of visits, site attributes and socio-economic variables such as the visitor’s place of origin, income, age, education, etc 3 obtain the visitation rates for each zone, and use this information to estimate the total number of visitor days per head of the local population 4 estimate travel costs, including both direct expenses (such as fuel and fares, food, equipment, accommodation) and time spent on the trip 5 carry out a statistical regression to test the relationship between visitation rates and other explanatory factors such as travel cost and socio-economic variables 6 construct a demand curve relating number of visits to travel cost, model visitation rates at different prices, and calculate visitor consumer surplus travel costs
travel costs freshwater recreation in the USA • Conservation Research Program (CRP) aims to mitigate environmental effects of agriculture • study to ascertain the impacts of improved environmental quality on freshwater recreation, fishing, hunting and wildlife • sample of 15,000 respondents from 4 states asking about number of visits, travel costs • combined benefit of CRP actions found to be $35 million/yr or $2.57/ha (Feather et al 1999)
hedonic pricing look at the ways in which the value of ecosystem goods and services are reflected indirectly in the prices of property the value of ecosystems for quality of life
hedonic pricing can be used to look at the changes in property prices which might occur due to changes in the landscape wrought by invasives • When: • the habitats being invaded have particular landscape beauty, and are associated with premium property prices • the invasions leads to difficulties accessing residential areas, or interferes with the provision of utilities such as water supplies
1 decide on the indicator to be used to measure the quality or quantity of an ecosystem good or service associated with a particular property 2 specify the functional relationship between property prices and all of the relevant attributes that are associated with them, including ecosystem goods and services 3 collect data on property prices in different situations and areas which have varying quality and quantity of ecosystem goods and services 4 5 use multiple regression analysis to obtain a correlation between property prices and the ecosystem good or service derive a demand curve for the ecosystem good or service hedonic pricing
hedonic pricing urban wetlands in the USA • valued wetland amenities in Portland Oregon metropolitan region • data set of 15,000 home sales • information gathered about property price and its structural, neighbourhood and environmental characteristics as well as socio-economic characteristics of buyer • wetlands classified, and distance from property computed • found wetland proximity exerted significant influence on property values (Mahan 1997)
replacement costs look at the market trade-offs of maintaining ecosystems for their goods and services via what it would cost to replace degraded or lost ecosystem services by alternative means the value of ecosystem services in terms of costs saved
replacement costs can be used to look at the changes in output that occur when invasive species impact on the provision of particular goods and services which can be replaced by alternative sources • When invasive species: • replace other species which yield marketed products or resources, and these species or products have to be sourced from elsewhere or replaced by other products • compromise water quality and supplies, requiring alternative sources of water supply or purification • lead to changes in soil fertility, necessitating the application of artificial fertilisers • destroy insects which provided pollination services, which have to be replaced artificially • degrade ecosystems which provided soil erosion control services, which have to be replaced by artificial soil erosion control structures
1 ascertain the benefits that are associated with a given ecosystem good or service, how it is used and by whom, and the magnitude and extent of these benefits 2 identify the most likely alternative source of product, infrastructure or technology that would provide an equivalent level of benefits to an equivalent population 3 calculate the costs of introducing and distributing, or installing and running, the replacement to the ecosystem good or service replacement costs
replacement costs wetland water quality in Uganda • Nakivubo swamp in central Kampala • receives and treats most of city’s industrial and residential wastewater • looked at costs of replacing wetland functions with on-site treatment plants and new sewerage system • found annual wetland water treatment service value of $2 million/yr (Emerton et al 1999)
mitigative & avertive expenditure look at the market trade-offs of maintaining ecosystems for their goods and services via what it would cost to undertake the actions required to mitigate or offset the negative effects of ecosystem service degradation or loss the value of ecosystem services in terms of costs saved
mitigative & avertive expenditure can be used to look at the cost of responding to or remediating the ecosystem damage or change that has been caused by invasives • When: • the invasive species replace important food species, requiring drought or famine relief to maintain local nutrition and food security • the invaded ecosystem provided flood attenuation services, which require the introduction of measures to mitigate or avert the effects of flooding on downstream settlements • the invasive species act as pests or diseases on plants, animals or humans, requiring vaccination or disease control measures to be set in place • the invaded ecosystem provided soil erosion control services, necessitating the installation of silt trapping and sediment removal structures downstream
1 identify the negative effects or hazards that would arise from the loss of a particular ecosystem good or service 2 locate the area and population who would be affected by the loss of the ecosystem good and service, and determine a cut-off point beyond which the effect will not be analysed 3 obtain information on people’s responses, and measures taken to mitigate or avert the negative effects of the loss of the ecosystem good or service 4 cost the mitigative or avertive expenditures mitigative & avertive expenditure
mitigative & avertive expenditure wetland flood control in Sri Lanka • Muthurajawela Swamp in densely-populated urban area on coast • water storage capacity prevents local flooding • looked at costs of mitigating effects of floods through drainage and pumping • found annual wetland value of $5 million/yr or $1,750/ha (Emerton and Kekulandala 2002)
damage costs avoided look at the market trade-offs of maintaining ecosystems for their goods and services via the costs and losses of the damages arising when ecosystem services are degraded or lost the value of ecosystem services in terms of costs saved
damage costs avoided can be used to look at looking at the cost caused to infrastructure and production when invasives interfere with the goods and services provided by a particular ecosystem • When: • the invaded ecosystem provided flood control services, and the consequent increase in the incidence and severity of flooding leads to damages to houses, roads and agricultural production • the invaded ecosystem provided water purification services, and the consequent decline in water quality leads to human health impacts • the invasive species act as pests or diseases on plants, animals or humans, leading to increased medical expenditures and losses in productivity
1 identify the protective services of the ecosystem, in terms of the degree of protection afforded and the on and off-site damages that would occur as a result of loss of this protection 2 for the specific change in ecosystem service provision that is being considered, locate the infrastructure, output or human population that would be affected by this damage, and determine a cut-off point beyond which effects will not be analysed 3 obtain information on the likelihood and frequency of damaging events occurring under different scenarios of ecosystem loss, the spread of their impacts and the magnitude of damage caused 4 cost these damages, and ascribing the contribution of the ecosystem service towards minimising or avoiding them damage costs avoided
damage costs avoided invasive alien plants in South Africa • invasion causes fire risks, and increases likelihood of fire damage on Cape Peninsula • damage also results in soil loss, erosion and likelihood of flooding • looked at costs of fire and flood damage, insurance claims, cleanup costs • costs per fire/flooding event of $150,000 (cleanup), $150,000 (flood damage), $5.7 million (insurance claims), costs of fire fighting ($0.5 million) (van Wilgen et al 2001)
contingent valuation ask consumers to state their preference directly, rather than looking at the way in which people reveal their preferences for ecosystem goods and services through market production and consumption the value of ecosystem services as perceived by individuals
contingent valuation can be used to look at the non-market values that people place on ecosystems that run the risk of invasion, and assessing people’s perceptions of option values for particular sites, species or products • When invasive species: • replaces species, or interferes with an ecosystem, which are objects of national heritage, special scientific interest, or international significance • replaces species, or interferes with an ecosystem, which may have future use values such as for hunting, leisure, as a gene pool • replaces species, or interferes with an ecosystem, which people wish to conserve for future generations
1 ask respondents their WTP or WTA for a particular ecosystem good or service 2 draw up a frequency distribution relating the size of different WTP/WTA statements to the number of people making them 3 cross-tabulate WTP/WTA responses with respondents’ socio-economic characteristics and other relevant factors 4 5 use multivariate statistical techniques to correlate responses with respondent’s socio-economic attributes gross up sample results to obtain the value likely to be placed on the ecosystem good or service by the whole population, or the entire group of users contingent valuation
contingent valuation • most contingent valuation studies are conducted via interviews or postal surveys with individuals, but sometimes interviews are conducted with groups. • the two main variants of contingent valuation are: • dichotomous choice surveys, which present an upper and lower estimate between which respondents have to choose • open-ended surveys, which let respondents determine their own bids • more sophisticated techniques are also sometimes used, such as engaging in trade-off games or using take-it-or-leave it experiments • the Delphi technique uses expert opinion rather than approaching consumers directly
contingent valuation watershed drought mitigation in Indonesia • focused on water catchment protection services of RutengNational Park, Flores • looked at local farmer WTP for drought mitigation services inrelation to rice irrigation water • asked whether would pay a set annual fee, followed up by questions about lower and higher fees • found mean annual stated WTP of$2-3/hhold, equivalent to 10% of annual agricultural costs, 75% of irrigation fees, 3% of food expenditures (Pattanayak and Kramer 2001)
market prices on-site marketed direct values production function approaches on-site and off-site marketed production values surrogate market approaches on-site recreation and leisure activities travel costs on-site property prices hedonic pricing cost-based approaches replacement costs on-site and off-site (unmarketed) indirect values mitigative & avertive expenditures damage costs avoided stated preference approaches on-site and off-site option and existence values contingent valuation applicability and relevance
limits to valuation • generates useful and convincing information for decision-makers and decision-making, and highlights costs and benefits that are usually ignored, but is … • a means to an end, not an end in itself: aim is to enable better and more informed decisions • is inexact: based on available knowledge and data at a particular time • not a stand-alone exercise: requires a multidisciplinary team, not just economists • partial: can never fully value ecosystem services • not universal: certain costs and benefits cannot and should not be valued • not easily transferable: most findings are specific to area, stakeholder group, socio-economic and natural conditions • often biased: studies and their findings are heavily influenced by the purposes for which they are carried out
summary of valuation methods stated preference methods revealed preference methods marketprices production function approaches surrogate market approaches cost-based approaches marketprices effect on production travelcosts replacementcosts contingent valuation hedonicpricing mitigative & avertive expenditures damagecosts avoided